

CFOITFM LeadTBM LeadFinOps LeadL2+
Flagship reference
AI Economics KPIs
A structured library of key performance indicators for governing AI cost, value, accountability, and portfolio performance.
Choose the right metrics to make AI spend visible, AI ownership clear, and AI value provable. Filter by governance domain, leadership role, or organisational maturity level.
CFOCIOCAIOFinOpsTBMITFMSPMEngineering
30 KPIs
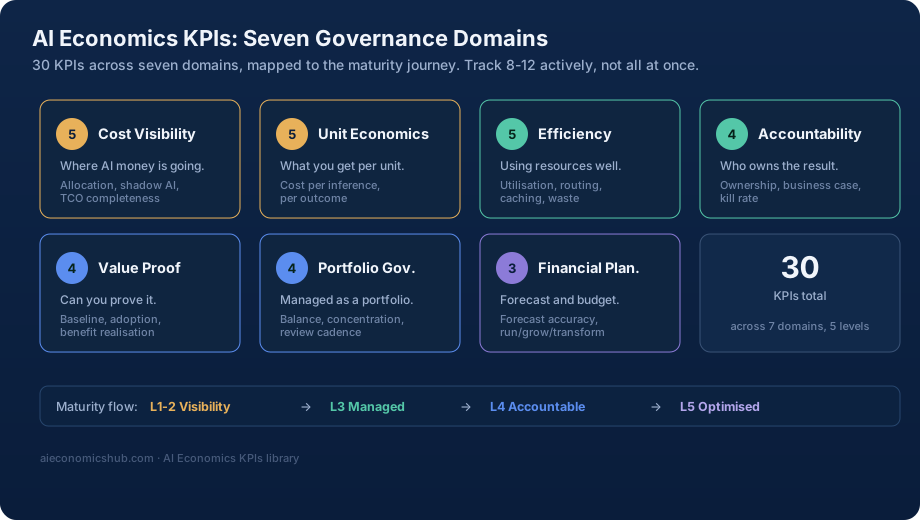
Across cost, value, ownership, portfolio, and planning
7 domains
Mapped to the operating disciplines behind AI economics
5 levels
Aligned to the maturity journey from experimental to optimised
How to use this library
Start with the governance question, then choose the smallest useful metric set.
This library provides a practitioner-ready set of KPIs for enterprise AI economics. Each metric includes a definition, formula, worked example, data source guidance, and benchmark context.
The KPIs are organised into seven governance domains that map directly to the site's core frameworks: the AI Value Gap, the AI TCO Framework, the AI Economics Maturity Model, and the domain operating models for FinOps, TBM, ITFM, and SPM.
Use the filters to find the metrics that matter for your role, your current maturity level, and the decision you are trying to improve. A mature AI economics practice typically tracks 8-12 KPIs actively, reviewed monthly or quarterly.
Cost visibility
Unit economics
Efficiency
Accountability
Value proof
Showing 30 of 30 KPIs
Governance domain
AI Cost Visibility
Metrics that measure whether the organisation can see where AI money is going. These KPIs address the Visibility Gap, the most common starting weakness in enterprise AI economics.
CFOCIOITFM LeadFinOps LeadL1+
CFOCIOITFM LeadL2+
TBM LeadFinOps LeadCIOCFOL3+
CIOFinOps LeadHead of EngineeringTBM LeadL2+
Governance domain
AI Unit Economics
Metrics that connect AI consumption to measurable units of output or business value. These are the KPIs that make AI spend economically legible, moving from "how much did we spend?" to "what did we get per unit of spend?"
Head of EngineeringFinOps LeadCAIO/VP of AIL3+
Head of EngineeringCAIO/VP of AIFinOps LeadSPM/Portfolio LeadL4+
CFOCAIO/VP of AISPM/Portfolio LeadTBM LeadL4+
Head of EngineeringFinOps LeadCAIO/VP of AIL3+
CFOCIOITFM LeadL2+
Governance domain
AI Efficiency & Optimisation
Metrics that measure how well the organisation uses its AI infrastructure and model resources. These are the FinOps-oriented KPIs that connect demand management, resource utilisation, and optimisation effort to cost outcomes.
Head of EngineeringFinOps LeadCIOL3+
Head of EngineeringCAIO/VP of AIFinOps LeadL4+
Head of EngineeringFinOps LeadL3+
FinOps LeadCFOITFM LeadL3+
FinOps LeadHead of EngineeringCIOL2+
Governance domain
AI Accountability
Metrics that measure whether someone actually owns the economic result of AI initiatives. These KPIs address the Accountability Gap, the pattern where everyone participates in AI but no one is answerable for whether it delivers value.
CFOCIOCAIO/VP of AISPM LeadL3+
CFOITFM LeadSPM LeadL3+
CAIO/VP of AICFOSPM LeadL4+
CIOCAIO/VP of AIHead of EngineeringL2+
Governance domain
AI Value Proof
Metrics that measure whether the organisation can demonstrate that AI is creating durable, attributable business value. These KPIs address the Proof Gap, the most politically sensitive dimension of AI economics.
CAIO/VP of AICFOSPM LeadTBM LeadL3+
CAIO/VP of AISPM/Portfolio LeadHead of EngineeringCIOL3+
CFOCAIO/VP of AISPM/Portfolio LeadL5
CFOSPM LeadITFM LeadL4+
Governance domain
AI Portfolio Governance
Metrics that measure whether AI is being governed as a managed portfolio of investments rather than a collection of independent projects. These KPIs support the strategic and SPM disciplines.
CFOCAIO/VP of AISPM LeadCIOL4+
CIOCAIO/VP of AIHead of EngineeringCFOL3+
CAIO/VP of AICFOCIOSPM LeadL3+
AllL1+
Governance domain
AI Financial Planning
Metrics that measure the quality of AI financial planning, forecasting, and budget governance. These KPIs serve the ITFM discipline and connect AI spend to broader enterprise financial management.
ITFM LeadCFOCIOL3+
CFOCIOL3+
CFOCIOITFM LeadSPM LeadL3+
Cross-reference
Map to your maturity level
Level 1
Experimental
- 1.2 Shadow AI Spend Ratio
- 1.3 AI Cost as % of IT Spend
- 1.5 AI Vendor Consolidation Ratio
- 4.4 AI Governance Span
Start by understanding what you are actually spending and where it is coming from.
Level 2
Visible
- 1.1 AI Spend Allocation Rate
- 2.5 AI Cost per Employee
- 3.5 AI Infrastructure Waste Rate
- 1.4 AI TCO Completeness Score
Focus on making AI cost visible, allocated, and complete.
Level 3
Managed
- 2.1 Cost per Inference
- 2.4 Token Efficiency Ratio
- 3.1 GPU Utilisation Rate
- 3.3 Prompt Caching Hit Rate
- 3.4 AI Commitment Coverage
- 4.1 AI Initiative Ownership Rate
- 4.2 AI Business Case Coverage
- 5.1 AI Baseline Definition Rate
- 5.2 AI Adoption Rate
- 6.3 AI Portfolio Review Cadence
- 7.1 AI Budget Forecast Accuracy
Shift from observing to actively managing cost, accountability, and planning.
Level 4
Accountable
- 2.2 Cost per Agentic Action
- 2.3 Cost per Business Outcome
- 3.2 Model Routing Efficiency
- 4.3 AI Initiative Kill Rate
- 5.4 AI Benefit Realisation Accuracy
- 6.1 AI Portfolio Balance Ratio
- 6.2 AI Portfolio Concentration Risk
- 7.2 AI Spend Growth Rate vs Revenue
Tie every initiative to an owner, a proof standard, and a portfolio-level comparison.
Level 5
Optimised
- 5.3 Capacity Redeployment Rate
- 6.4 AI Maturity Level (Self-Assessed)
- 7.3 AI Run/Grow/Transform Ratio
Govern AI as a strategic economic portfolio with continuous optimisation.
Do not try to track all 30 KPIs at once. A mature AI economics practice typically tracks 8-12 KPIs actively, reviewed monthly or quarterly. Start with the KPIs recommended for your current maturity level. Add new KPIs as your governance capability strengthens. The goal is measurement that changes decisions.
Related reading
Connect the KPIs to the wider framework
AI Value Gap
The three gaps these KPIs help close
AI Economics Maturity Model
The maturity framework that determines which KPIs matter when
AI TCO Framework
The cost structure that many of these KPIs measure
AI ROI Models
The value frameworks that the proof KPIs support
FinOps & AI
The operating discipline behind the efficiency KPIs
TBM & AI
How KPIs connect to service and portfolio views
ITFM & AI
How KPIs connect to planning and forecasting
SPM & AI
How KPIs support portfolio governance