

Why a maturity model is needed
AI leadership discussions often confuse adoption volume with economic readiness. A useful maturity model should measure governance quality.
Many maturity conversations still focus on how much AI an organisation is using. That is not the same as whether the organisation can govern AI economically. An enterprise can have dozens of pilots and still be immature if it cannot explain where cost is gathering, who owns outcomes, or how value is being proved.
The research is consistent on this. MIT CISR finds that the most meaningful financial returns from AI appear when organisations move from scattered pilots into scaled, repeatable ways of working - not simply by deploying more technology. McKinsey's 2025 State of AI shows widespread AI adoption, but only about 6% of respondents attributing 5% or more of EBIT to AI and reporting significant value. FinOps Foundation's 2026 data is precise: governance, forecasting, and organisational alignment rank as higher priorities than optimisation for AI scope - the signature of an industry still working on the foundational disciplines rather than refinement. IDC adds, as reported in April 2026, that only 7.5% of enterprises are embedding FinOps into AI projects. These numbers describe an industry with broad experimentation and weak governance, not with weak technology.
The five levels
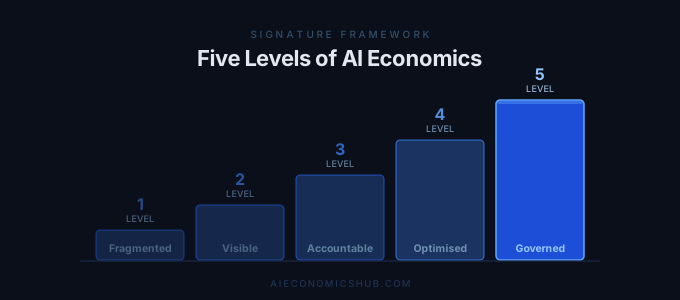
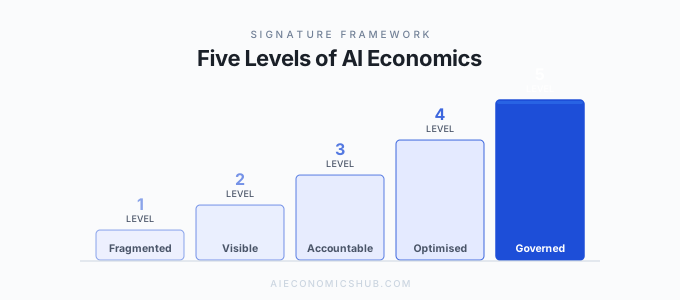
The framework is cumulative. Each level adds management capability rather than merely more AI deployment.
Experimental
AI is funded and discussed primarily as experimentation. Teams run pilots, test vendors, and explore use cases, but cost visibility and value ownership remain weak.
Primary signal
Activity is visible, but the economics remain fragmented and mostly anecdotal.
Visible
The organisation begins to see where AI spend is appearing across tools, APIs, platforms, and workloads. Reporting improves, but accountability is still partial.
Primary signal
Leadership can identify major spend surfaces, but still struggles to explain whether that spend is justified.
Managed
AI demand begins to be governed operationally. Shared standards emerge around cost, usage, controls, and platform behaviour, and AI starts to enter structured management disciplines.
Primary signal
The organisation is no longer only observing cost. It is beginning to manage the conditions that create it.
Accountable
AI investments are tied to named owners, defined return dimensions, and clearer proof standards. Scale decisions start to depend on evidence rather than momentum alone.
Primary signal
Leadership can explain not only what AI costs, but who owns the expected value and how it will be tested.
Optimised
AI is governed as a portfolio of capabilities with visible economics and active prioritisation. High-performing use cases scale faster, while weak demand is challenged earlier.
Primary signal
The organisation manages AI as a strategic economic portfolio rather than a loose collection of experiments and services.
What each level looks like in practice
The levels become useful when teams can recognise their current pattern and the next operating move.
Level 1: Experimental
At Level 1, AI activity is energetic but economically thin. Costs sit in innovation budgets, software trials, local cloud accounts, or team-level experiments. Value is described in general terms such as productivity, innovation, or momentum.
Composite example: a diversified industrial group is running 27 AI pilots across sales, service, and engineering, but has no common inventory, no cost baseline, and no agreed owner for value realisation. The same workflow is being tested with three vendors in parallel.
Common pattern: the organisation confuses experimentation volume with strategic progress.
Priority actions for each role:
- FinOps Lead: create the first AI spend inventory across vendors, cloud accounts, and SaaS tools.
- TBM Lead: decide where AI spend will sit in cost pools and resource towers before more demand arrives.
- CFO: require a simple distinction between exploratory spend and operating spend.
- CIO: define whether a shared AI platform team exists or whether experimentation remains decentralised.
- Head of Engineering: document the largest technical demand drivers and duplicated experiments.
- VP of AI: establish a central register of pilots, sponsors, owners, and intended outcomes.
Level 2: Visible
At Level 2, reporting improves. Leaders can see major AI spend surfaces across tools, APIs, cloud capacity, and selected teams. The organisation can talk about cost, but not yet govern it with confidence.
Composite example: a mid-market financial services firm has consolidated its AI tool inventory and can now report about GBP 2.4 million in annual AI-related spending across 14 tools, three cloud platforms, and six API providers. But no single leader owns the AI cost envelope, and value is still described in terms of time saved per employee without baseline measurement.
Common pattern: the organisation mistakes improved reporting for maturity.
Priority actions for each role:
- FinOps Lead: begin reporting cost per inference or cost per workflow for the top AI services.
- TBM Lead: separate shared platform cost from local business demand in the service model.
- CFO: insist that AI funding requests include total cost of ownership, not only vendor prices.
- CIO: define boundaries between enterprise AI platform investment and business-unit experimentation.
- Head of Engineering: instrument the most expensive workflows for token, latency, and fallback visibility.
- VP of AI: map initiatives by owner, maturity, and expected return dimension.
Level 3: Managed
At Level 3, AI demand begins to be governed operationally. Shared standards emerge for routing, model usage, controls, reporting cadence, and workflow design. This is often where FinOps & AI and TBM & AI become formal parts of the operating model.
Composite example: a global retailer has established AI as a formal FinOps scope, reports monthly on spend by platform and product area, and can show cost per assisted customer interaction. It can forecast run-rate spend with reasonable confidence, but still struggles to show which use cases are producing durable business return.
Common pattern: cost discipline improves faster than value discipline.
Priority actions for each role:
- FinOps Lead: establish AI as a formal FinOps scope with a dedicated reporting cadence.
- TBM Lead: map AI costs into Technology Resource Towers using TBM Taxonomy 5.0 structures.
- CFO: require TCO-based review and expected return dimensions for major initiatives.
- CIO: formalise shared AI platform versus local experimentation boundaries and service levels.
- Head of Engineering: implement cost per inference and cost per action tracking at service level.
- VP of AI: maintain a central register of all AI initiatives with cost, owner, and status.
Level 4: Accountable
At Level 4, the organisation can explain what AI costs, who owns the target outcome, and what proof threshold applies before more scale is approved. The debate shifts from enthusiasm to evidence.
Composite example: a healthcare services organisation reviews AI initiatives quarterly by owner, baseline, cost envelope, risk class, and expected return dimension. Underperforming use cases are redesigned or stopped, while proven workflow automation receives additional funding.
Common pattern: initiative-level accountability is strong, but portfolio comparison remains uneven.
Priority actions for each role:
- FinOps Lead: connect unit economics to outcome reporting and scenario forecasting.
- TBM Lead: expose which capabilities and consumers are absorbing shared AI platform cost.
- CFO: introduce staged investment gates tied to proof and dependency level.
- CIO: govern platform investment through portfolio comparisons rather than one-off exceptions.
- Head of Engineering: tie performance and reliability metrics to economic thresholds for scale.
- VP of AI: standardise proof packs for executive review across all major initiatives.
Level 5: Optimised
At Level 5, AI is governed as a comparative portfolio. Leadership can compare cost structures, demand patterns, risk burden, and outcome evidence across multiple capabilities and redirect capital with confidence.
Composite example: a multinational services firm uses a portfolio review model to rank AI initiatives by strategic fit, cost-to-serve, realised value, and reuse potential. Shared platform investment is justified through portfolio economics, not through narrative alone.
Common pattern: success breeds complacency unless the organisation keeps adapting its model.
Priority actions for each role:
- FinOps Lead: continuously optimise AI unit economics and forecasting based on adoption curves.
- TBM Lead: use portfolio-grade cost models to support showback, chargeback, and scenario planning.
- CFO: compare AI capital allocation against other transformation bets using common standards.
- CIO: steer platform evolution based on reuse, resilience, and portfolio economics.
- Head of Engineering: embed cost-awareness into engineering design and release governance.
- VP of AI: rebalance the portfolio between predictable ROI, strategic innovation, and breakthrough exploration.
How to diagnose your current level
The model is most useful when different leaders can test the same estate from their own vantage point.
Use the same estate-wide questions across roles. Can the organisation distinguish shared AI platform spend from local demand? Can it explain cost per service or workflow? Are major initiatives assigned to named value owners? Is there a common proof threshold before scale? Can leaders compare initiatives against one another rather than only against their own business cases?
If reporting exists but ownership and proof remain weak, the organisation is typically between Levels 2 and 3. If ownership exists at initiative level but portfolio decisions still rely on narrative, the organisation is often between Levels 3 and 4. If portfolio comparison, stage gating, and capital reallocation are routine, Level 5 is in view.
Score each dimension
An average level hides weak spots. Scoring ten dimensions separately shows where to work first.
Score each dimension from 1 (Experimental) to 5 (Optimised), using only what you can show. If you cannot point to evidence for a score, score it one lower.
| Dimension | The question it answers |
|---|---|
| Inventory | Do we know every AI tool, vendor, platform, agent and use case, and who owns each? |
| Cost visibility | Can we see the full cost, including what sits outside the model invoice? |
| Workload attribution | Can we tie consumption and shared cost to specific workloads or outcomes? |
| Baseline and outcome measurement | Is there a baseline and a measured outcome for material workloads? |
| Evidence strength | How strong is the evidence behind value claims? |
| Value classification | Do we separate realised, avoided, released and estimated value? |
| Governance and risk | Does proof rise with risk and autonomy, and can initiatives be stopped? |
| Decision execution | Do scale, hold, redesign and stop decisions get made and carried out? |
| Executive reporting | Do executives and the board see a consistent, decision-ready view? |
| Operating ownership | Is accountability for cost, value, evidence and review named and working? |
Then answer twelve readiness questions across four areas.
- People: Are outcome owners named? Can finance validate material claims? Is review capacity available?
- Process: Are initiatives reviewed against gates and exit criteria? Are decisions executed? Are benefit types distinguished?
- Data and technology: Can consumption be joined to workloads? Are quality and rework visible? Are shared costs allocable?
- Governance: Does proof rise with risk and autonomy? Are exceptions owned and time-bound? Can initiatives be stopped?
The output is a current level, a target level, the highest-risk gaps, the first 90 days of actions, the metrics to establish and the artefacts to implement. The maturity assessment workbook (Excel, version 0.5, 8 October 2026) holds the dimensions, the readiness questions and a summary, with illustrative scores in blue that you overwrite. It is a proposal from this site, not a standard, and a self-assessment: independent challenge of the scores improves it.
What moves organisations upward
Progress depends on management disciplines strengthening together, not on more AI activity.
Five forces drive the transition upward: better visibility, clearer ownership, stronger operating discipline, higher proof standards, and more explicit portfolio governance. These are why The AI Value Gap, AI TCO Framework, and AI ROI Models connect so closely to this framework.
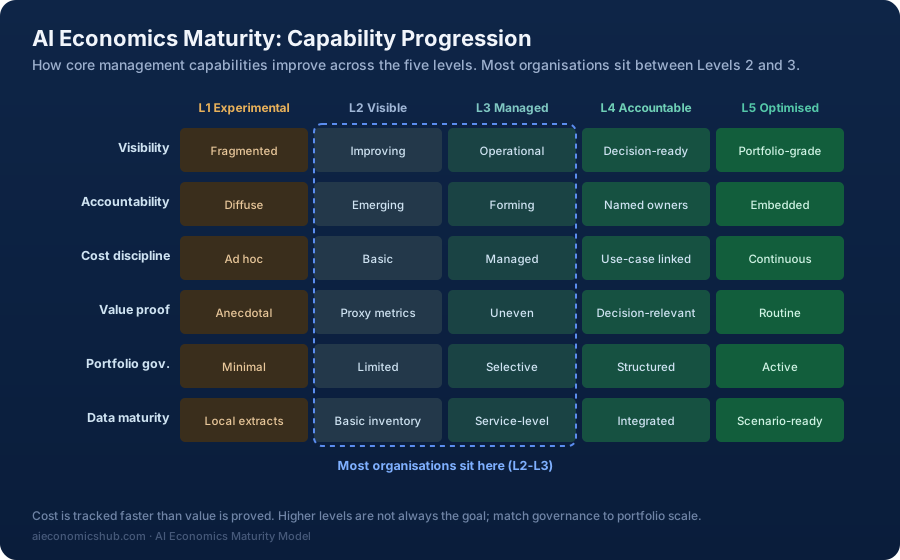
Capability progression matrix
The matrix below shows how core management capabilities typically improve across the five levels.
Where most organisations sit today
The external evidence below is consistent with a market still concentrated in the lower-middle levels. It does not measure the five levels directly.
The external evidence places most organisations between Levels 2 and 3. FinOps Foundation's 2026 data confirms that AI spend is now part of 98% of FinOps practices - a reasonable proxy for improved cost visibility. But governance maturity and proof discipline tell a different story. McKinsey finds about 39% of respondents report any EBIT impact from AI, and about 6% attribute 5% or more of EBIT to it. IDC reports only 7.5% of enterprises are embedding FinOps into AI projects. IBM's Institute for Business Value, an IBM-owned source, reports that only 25% of executives say their organisations consistently measure business value and AI ROI. These figures describe an industry with strong Level 1 to Level 2 progress but limited Level 3 and beyond capability. Cost is being tracked. Ownership, proof standards, and portfolio governance are not yet functioning at comparable depth in most organisations.
Level transitions
The transition points matter because that is where consulting teams, portfolio leaders, and executive sponsors usually struggle.
Level 1 to Level 2
Trigger: AI activity becomes too widespread to treat as experimentation alone.
Hardest part: building a complete inventory across tools, platforms, and hidden budgets.
What takes longest: agreeing a common cost language across finance, technology, and business teams.
Level 2 to Level 3
Trigger: leaders can see spend and now need to influence the conditions creating it.
Hardest part: moving from dashboards to operating cadence, ownership, and policy.
What takes longest: instrumenting workflows well enough to produce useful unit economics and forecasts.
Level 3 to Level 4
Trigger: AI is becoming operationally important enough that cost control alone is insufficient.
Hardest part: assigning named value owners and enforcing proof thresholds before scale.
What takes longest: linking benefit claims to credible baselines and realised business outcomes.
Level 4 to Level 5
Trigger: multiple AI capabilities now compete for capital, platform capacity, and executive attention.
Hardest part: comparing initiatives systematically instead of letting each defend itself on its own narrative.
What takes longest: building portfolio-grade data and governance routines that can support capital reallocation with confidence.
Is Level 5 always the goal?
AI is moving from pilot-era experimentation to operating-model dependency. That raises the cost of immaturity.
Most maturity models carry an implicit assumption that higher levels are universally better and that organisations should aspire to reach the highest level as quickly as resources allow. This assumption deserves challenge.
Level 5 governance - with a fully active portfolio comparison function, continuous optimisation, and portfolio-grade data infrastructure - is appropriate for organisations with a large, diverse AI portfolio where comparative capital allocation decisions have real consequence. For those organisations, the investment in Level 5 capability is justified because the decisions it enables are worth more than the governance overhead it creates.
For many other organisations, Level 3 or Level 4 is the economically optimal operating state. A £3M AI portfolio focused on a small number of proven use cases does not need the portfolio comparison infrastructure of an organisation managing £30M across forty initiatives. Over-investing in governance sophistication relative to portfolio size and complexity creates overhead without commensurate benefit - which is a form of misallocation as real as under-investing.
The framework is therefore better used as a diagnostic and a progression guide than as an aspiration in itself. The useful questions are: what level of governance is adequate for the scale and risk of the portfolio we are running? What specific capability is missing that is causing real management decisions to be worse than they should be? And what is the proportionate investment to close that specific gap?
An organisation with strong visibility and accountability but immature portfolio comparison capability should invest in Level 4 to Level 5 transitions. An organisation with immature visibility should invest in Level 1 to Level 2 transitions first - the more sophisticated governance layers are not useful without the foundational ones. And an organisation that has good Level 3 governance over a small, stable AI portfolio may be making the right call by not investing in Level 4 and 5 infrastructure until its portfolio size justifies it.
The framework is calibrated to help organisations become better governed, not to produce governance for its own sake.
Why this framework matters now
When AI is optional, weak economics can be tolerated for a while. When it becomes embedded in core workflows, customer journeys, software delivery, and planning processes, weak economics become a strategic liability. The Five Levels framework matters because it gives leadership teams a shared way to judge whether governance is improving fast enough to support scale - and whether the governance investment is proportionate to the scale being supported.
Conclusion
The framework is meant to be used, challenged, and applied across the rest of the hub.
The most useful dividing line in enterprise AI is not between organisations that use AI and those that do not. It is between organisations that can govern AI economically and those that cannot. The first group can answer four questions with evidence: what does it cost in full, who owns the outcome, what does proof look like, and which initiatives should scale or stop? The second group answers these with narrative. The framework exists to make that gap visible - and to identify, specifically, which management capability is missing rather than leaving the answer as "we need better AI governance".
Related reading
The Layers of AI Value Management
Use the layer model to connect maturity with the evidence needed for cost, quality, productivity, delivery, and portfolio decisions.
The AI Value Gap
Start with the core diagnosis explaining why cost, ownership, and proof often drift apart.
AI TCO Framework
Use the seven-layer cost stack to understand what stronger visibility actually requires.
AI ROI Models
Connect maturity to stronger proof standards and return models.
SPM & AI
See how portfolio governance and sequencing become critical at the higher maturity levels.
TBM & AI
Understand how service and capability modelling supports the move from visibility to accountability.
FinOps & AI
Understand how AI scope, forecasting, and unit economics support the move from visibility to management.