

The cost model problem
Our estimate: the model invoice is often only 10 to 20% of true enterprise AI cost.
For an enterprise running production AI use cases on commercial foundation models and cloud infrastructure, infrastructure, people, integration, and governance routinely outweigh the vendor bill that dominates internal cost discussions. IDC warns that large enterprises risk materially underestimating AI infrastructure spend as estates scale. The same pattern appears in FinOps Foundation data: AI cost governance has expanded rapidly, but forecasting and allocation - the disciplines that require a full cost model - remain undermatured relative to basic spend reporting.
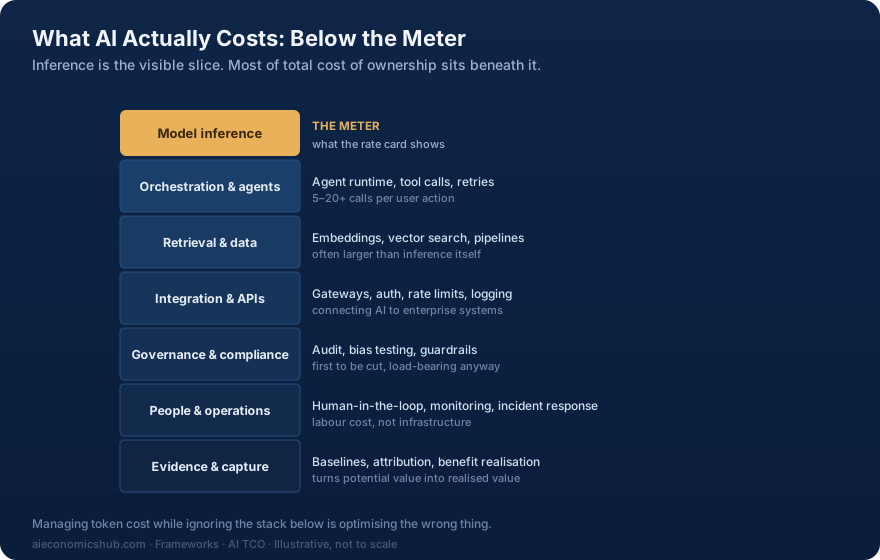
Why enterprise AI TCO needs a wider frame
The model invoice is visible. The operating system around the model is where enterprise economics usually become distorted.
Most AI business cases are built on what is easiest to price: the API rate card, the SaaS premium, or the hosting bill. Those figures are real, but they describe only the model layer - one part of a seven-layer cost structure. A good deal of AI spend also sits outside formal IT budgets, in departmental tools and AI tiers bundled into existing software contracts. As estates scale, that invisible spend creates cost curves that finance teams did not model and cannot explain.
By May 2026, the Wall Street Journal had reported corporate AI rationing (paywalled) as costs outpaced budgets - a market signal that incomplete TCO models were becoming harder to sustain at scale.
The consequence is predictable. Organisations approve investment based on narrow cost estimates, then discover in year two that infrastructure, people, governance, and integration obligations dwarf the original vendor invoice. The TCO framework exists to stop that pattern before it starts: to give leaders a complete picture of what a production AI capability actually costs, across all seven layers, before capital is committed.
The 7-layer AI cost stack
The stack shows where burden sits, how it grows, and why two deployments with similar model cost can have very different enterprise economics.
Layer 1
Infrastructure
Typical range this layer can reach: 30% to 45% of total AI TCO, depending on deployment. This layer expands quickly with concurrency, sovereignty, resilience, and GPU intensity.
Includes
- accelerated compute and GPU capacity
- storage, networking, and runtime services
- clusters, containers, and platform environments
- regional redundancy and resilience
Layer 2
Data and context
Typical range this layer can reach: 10% to 18% of total AI TCO, depending on deployment. This layer often grows when retrieval, metadata quality, and refresh requirements become serious.
Includes
- data ingestion and transformation
- retrieval pipelines and vector systems
- indexing, metadata, and provenance
- refresh and context-quality controls
Layer 3
Models
Typical range this layer can reach: 10% to 20% of total AI TCO, depending on deployment. This is the most visible cost layer, but often not the dominant one. See Token Economics for detailed metering mechanics.
Includes
- API tokens or requests
- SaaS AI licence premiums
- reserved capacity or committed spend
- fine-tuning or model adaptation usage
Layer 4
Integration and workflow redesign
Typical range this layer can reach: 10% to 20% of total AI TCO, depending on deployment. This is where a useful demo becomes a real operating capability.
Includes
- application design and product changes
- system integration and API work
- identity, access, and policy enforcement
- workflow redesign and adoption effort
Layer 5
People and capability
Typical range this layer can reach: 25% to 35% of total AI TCO, depending on deployment. AI-specific labour often remains the single most undercounted cost category.
Includes
- platform engineers and product engineers
- data and ML specialists
- AI governance and assurance labour
- training, enablement, and operating support staff
Layer 6
Governance, safety, and compliance
Typical range this layer can reach: 8% to 15% of total AI TCO, depending on deployment. Often higher in regulated settings.
Includes
- evaluation and benchmark design
- red teaming and human review
- policy, auditability, and compliance support
- security, legal, and risk coordination
Layer 7
Operations and portfolio oversight
Typical range this layer can reach: 5% to 10% of total AI TCO, depending on deployment. This layer determines whether AI remains governable as a service and a portfolio.
Includes
- monitoring and observability
- incident response and vendor management
- allocation, showback, and chargeback logic
- portfolio review and value assurance
Deployment models and how the stack changes
No deployment model removes the stack. It only redistributes who carries it and which layers dominate.
Comparison of deployment models showing which cost layers dominate the TCO profile
SaaS AI
- Dominant cost layers
- Models, integration, people, governance
- Primary governance disciplines
- Procurement, ITFM, TBM, risk
- Typical economic pattern
- Fastest route to value, but licence premiums and workflow sprawl can accumulate quietly
- Best fit
- Packaged use cases where speed and adoption support matter more than deep control
API consumption
- Dominant cost layers
- Infrastructure, models, integration, operations
- Primary governance disciplines
- FinOps, engineering, product, security
- Typical economic pattern
- Flexible but highly sensitive to usage behaviour, routing, and orchestration design
- Best fit
- Differentiated application workflows where the organisation wants product control
Fine-tuned commercial
- Dominant cost layers
- Models, data and context, evaluation, people
- Primary governance disciplines
- Procurement, FinOps, engineering, risk
- Typical economic pattern
- Higher stewardship cost justified only where domain adaptation materially changes value
- Best fit
- Sensitive or domain-specific use cases with strong quality requirements
Open-source self-hosted
- Dominant cost layers
- Infrastructure, people, operations, governance
- Primary governance disciplines
- FinOps, TBM, engineering, architecture
- Typical economic pattern
- Lower vendor dependence but significantly higher internal platform burden
- Best fit
- Scale, sovereignty, or control requirements with strong platform maturity
Custom-built
- Dominant cost layers
- Infrastructure, people, data, evaluation, governance
- Primary governance disciplines
- SPM, TBM, CFO, engineering leadership
- Typical economic pattern
- Strategic posture rather than a convenience choice; highest long-run burden
- Best fit
- Only where differentiation or control justifies sustained capital and talent commitment
Deloitte's modelled crossover
84 billion annual tokens under specific assumptions
Deloitte's 2025 analysis modelled when owned AI infrastructure becomes economically competitive with API consumption. Under its scenario, the crossover appears around 84 billion annual tokens for a specific hardware configuration (NVIDIA B200), US-based costs, and hourly neocloud pricing.
Critical limitations:
- The model explicitly excludes storage and egress costs
- Security infrastructure is not included
- One-time integration costs are excluded
- Staffing and operational labour are excluded
- Hardware obsolescence risk is not modelled
- The threshold is scenario-specific, not a universal benchmark
Use carefully: This is strong evidence for the shape of the cost curve and the existence of build-versus-buy inflection points. It is not a rule that applies to every workload. Actual crossover points shift materially with utilisation, model requirements, data residency, operational capability, and the full cost categories listed above.
Real-world variance (May 2026): Inferbase's enterprise pricing audit suggested that self-host crossover economics for a 70B model can emerge around 10-50 billion tokens per month of steady traffic, depending on infrastructure choices and fully loaded cost accounting. The wide range reflects differences in caching efficiency, output-to-input ratios, and whether side-charges are included in the comparison.
Sourcing model considerations
Each sourcing approach redistributes TCO across the seven layers and creates different risk profiles.
Packaged SaaS AI
TCO profile: Layers 3 (models), 4 (integration), 5 (people), and 6 (governance) dominate. Infrastructure is bundled into the licence.
Economic pattern: Fastest time to value, but licence premiums and seat-based pricing can create hidden consumption exposure as usage scales.
Risk considerations: Limited visibility into underlying token consumption, vendor lock-in, data residency constraints, limited model choice.
Best fit: Standardized use cases where speed, adoption support, and reduced operational burden justify premium pricing.
API consumption (pay-per-use)
TCO profile: Layers 1 (infrastructure), 3 (models), 4 (integration), and 7 (operations) dominate.
Economic pattern: Highly flexible but sensitive to usage behaviour, routing efficiency, context design, and agent orchestration patterns.
Risk considerations: Price volatility, demand unpredictability, vendor dependency, limited capacity guarantees during peak demand.
Best fit: Variable or uncertain demand, rapid experimentation, differentiated application workflows where product control matters.
Reserved capacity or committed spend
TCO profile: Similar to API but with commitment risk. Layers 1, 3, 4, and 7 remain dominant.
Economic pattern: Discounted unit costs in exchange for volume or spend commitments. Savings require accurate forecasting.
Risk considerations: Commitment waste if demand falls short, forecast error, model changes during contract period, reduced flexibility.
Best fit: Predictable base demand with understood growth patterns, where discount justifies commitment risk.
Managed or neocloud capacity
TCO profile: Layers 1 (infrastructure), 5 (people), and 7 (operations) increase. Provider manages infrastructure but customer retains more control.
Economic pattern: Dedicated or specialized infrastructure operated by provider. Higher control than pure API, lower burden than full ownership.
Risk considerations: Shared responsibility complexity, provider concentration, capacity constraints, migration difficulty.
Best fit: Performance-sensitive workloads, regional or security requirements, organizations lacking facilities capability.
Private or owned infrastructure
TCO profile: Layers 1 (infrastructure), 5 (people), 7 (operations) become dominant. Layers 2 (data) and 6 (governance) also increase.
Economic pattern: Lower vendor dependency but significantly higher internal platform burden. Requires high utilization to justify capital.
Risk considerations: Capital exposure, stranded capacity, rapid hardware obsolescence, power and cooling, staffing, slower deployment, refresh cycles.
Best fit: Large predictable demand, high utilization, material latency or sovereignty needs, strong platform maturity.
Edge or device inference
TCO profile: Layers 1 (infrastructure) shifts to device costs. Layers 4 (integration) and 5 (people) increase for deployment complexity.
Economic pattern: Reduces ongoing API costs but increases device, deployment, and model optimization burden.
Risk considerations: Model size constraints, device heterogeneity, update complexity, limited model capability, security at edge.
Best fit: Latency-critical applications, privacy requirements, offline operation, high-volume low-complexity inference.
Governance mapping by layer
Each cost layer has a natural primary discipline, but no single discipline can govern the whole stack alone.
- Layer 1 Infrastructure: FinOps is primary for live consumption governance; TBM helps allocate and translate shared platform cost.
- Layer 2 Data and context: Engineering and architecture lead design; TBM and ITFM help model the recurring service burden.
- Layer 3 Models: Procurement and FinOps should jointly govern rate structures, committed use, caching, and provider choice.
- Layer 4 Integration and workflow redesign: Product, engineering, and SPM govern whether the capability is worth embedding.
- Layer 5 People and capability: ITFM and SPM are essential for labour planning, staffing, and portfolio sequencing.
- Layer 6 Governance, safety, and compliance: Risk, security, legal, and service owners govern the control burden.
- Layer 7 Operations and portfolio oversight: FinOps, TBM, service management, and portfolio leadership need a shared review cadence.
TCO traps practitioners recognise
The most common traps are not arithmetic mistakes. They are recurring structural misunderstandings.
- The Jevons paradox: as per-token cost falls, consumption often rises faster than cost declines, especially in agentic systems that consume five to thirty times more tokens per task. See Token Economics for the consumption dynamics.
- Shadow AI: IDC reports that more than half of AI tool spending sits outside formal IT budgets, which makes enterprise TCO systematically incomplete and contributes to the AI Value Gap.
- The inference iceberg: at scale, inference can overtake training economics quickly; the ongoing service burden becomes the main bottleneck.
- Shared platform cost socialisation: foundational platform spend is spread across the estate in ways that make individual use cases look cheaper than they are.
- Governance overhead blindness: red teaming, security review, human oversight, and compliance work are real cost layers, not optional extras.
- False build-versus-buy comparisons: leaders compare vendor price to infrastructure price while ignoring people, operations, and control requirements.
- Pilot-era denominators: business cases stay anchored to early assumptions long after the service has acquired production obligations.
What this means for enterprise decision-makers
TCO should change how leaders ask questions, not merely how they total numbers.
For CIOs, the implication is direct: architecture choices are economic choices. Selecting a deployment model, a platform vendor, or a context architecture without modelling layers 1 through 7 produces a cost structure that surprises the organisation rather than serving it.
For CFOs, the risk is that AI cannot be governed as a single spend category. It requires a cost model across infrastructure, integration, people, and governance before it can be compared against other investment options in credible terms.
For Heads of Engineering, the message is that product and workflow design are now cost design. Token consumption, context length, fallback patterns, and model routing are cost decisions with material budget consequences at scale.
For FinOps, TBM, ITFM, and SPM teams, the practical task is to connect variable consumption, shared capability investment, and portfolio proof in one management model. No single discipline spans all seven layers. Collaboration across them is the governance design choice, not an optional alignment exercise.
Related reading
Token Economics
Understand the metering layer that sits within the model cost component of the TCO stack.
The AI Value Gap
See why weak cost visibility and weak proof of value often scale together across enterprise AI portfolios.
AI ROI Models
Pair TCO analysis with structured return measurement to make defensible investment decisions.
FinOps & AI
Understand how demand and unit-cost governance fit into the wider TCO model.
TBM & AI
Use TBM disciplines to connect AI platforms, services, and business capabilities back to cost and value.
ITFM & AI
Bring planning, forecasting, allocation, and management reporting discipline into the AI cost conversation.
What Cloud Taught Us About the Real Cost of AI Inference
Why headline per-token rates understate enterprise inference bills and how to model fully loaded inference economics.