


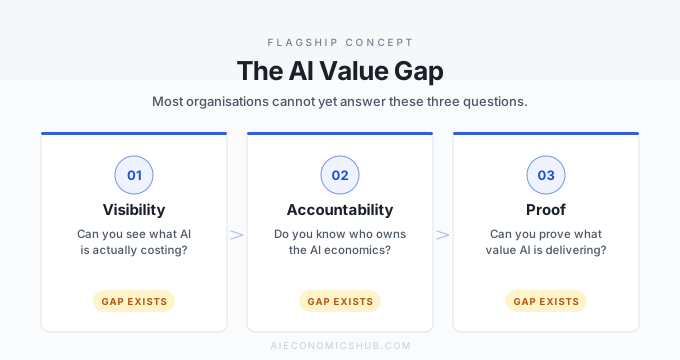
In May 2026, Uber's COO said of the company's AI coding spend: "it's very hard to draw a line" between usage and shipped customer value - weeks after the company spent its annual AI budget in four months. That sentence, from that company, is the AI value gap in the wild. This essay defines the gap, prices it, explains why it persists, and sets out the only reliable way to close it.
1. The gap, defined operationally
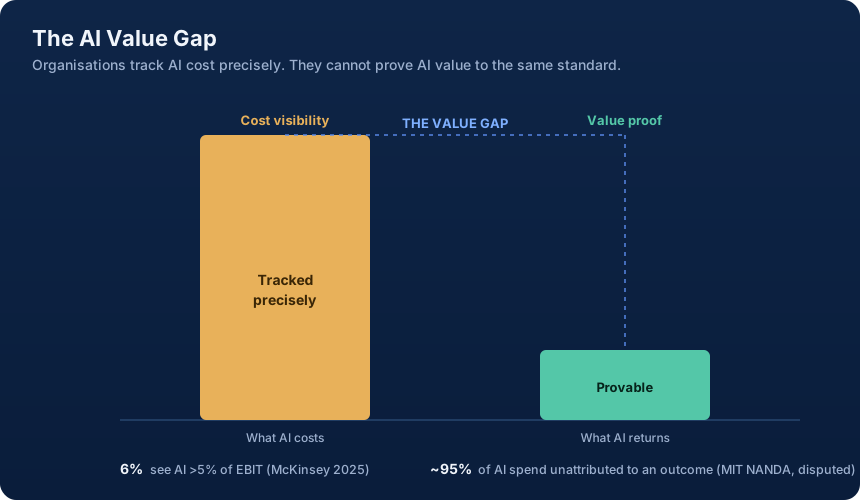
The AI Value Gap is the difference between what an organisation spends on AI and the share of that spend it can connect to a measured outcome. The measure is attribution coverage: the percentage of AI expenditure linked to a baseline, an owner, and evidence of change. The gap is its complement.
The root cause is a two-meter asymmetry. Cost telemetry is token-level, granular and real-time. Value telemetry is manually defined, delayed and contested. The incidents in the case files share this pattern: organisations can see what they spend almost in real time, but struggle to state what they gained even by the quarter.
Not the same gap as BCG's
The phrase is also used by Boston Consulting Group, whose report The Widening AI Value Gap (October 2025) compares companies: about 5% it calls future-built, against about 60% reporting minimal value. That is a gap between firms. The gap on this page is inside one firm, between its two meters: the share of its own AI spend it can connect to a measured outcome. The two are related but answer different questions. BCG's study describes who is winning; attribution coverage is one way an organisation can tell, from its own books, which side of that line it is on.
BCG's 2026 edition, the Applied AI Index (30 September 2026, 1,330 senior leaders), reports that nearly half of companies now create value from AI: 7.5% it calls future-built and a further 41% scaling. On BCG's own tiers that is up from about 5% future-built and 35% scaling a year earlier. It is an executive survey, not audited returns, and it measures the same between-firm gap. It does not tell any one organisation what share of its own spend it can connect to an outcome.
The gap can emerge at multiple points in the conversion chain:
- Unused capacity: Reserved or committed AI capacity that sits idle
- Wasteful token consumption: Agent loops, retries and context bloat that produce no useful output
- Rejected output: AI-generated work that fails review or is discarded
- Review and rework: Human effort correcting, validating or redoing AI outputs
- Recommendations not acted upon: Insights generated but never implemented
- Benefits not captured: Time saved but not redeployed; capacity released but not banked
- Strategic opportunity cost: Capital allocated to low-return AI rather than higher-value alternatives
Understanding Token Economics helps organisations see the cost meter clearly. But cost visibility alone does not close the gap. The organisation must also build work-unit attribution that connects tokens to tasks, tasks to accepted outputs, and outputs to measured outcomes with named owners and capture status.
Where the gap opens: a worked portfolio
"Value gap" is useful as a diagnosis only if it can be broken down. The gap is not one missing number. It is a series of tests that AI spend has to pass before it can support a decision, and each test is owned by someone different.
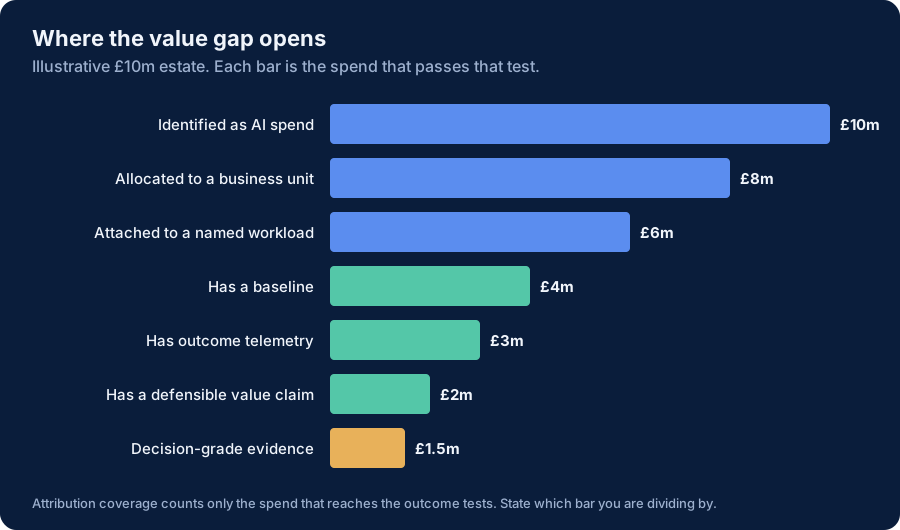
| Test | Illustrative spend | What fails at this step | Usual owner of the fix |
|---|---|---|---|
| Identified as AI spend | £10m | Embedded SaaS AI and expensed tools not yet found | FinOps, procurement |
| Allocated to a business unit | £8m | Shared platform cost with no allocation rule | FinOps, ITFM |
| Attached to a named workload | £6m | Calls with no workload ID | Platform engineering |
| Has a baseline | £4m | No measurement before rollout | Business owner |
| Has outcome telemetry | £3m | Outcome lives in a system nobody has joined | Business owner, data |
| Has a defensible value claim | £2m | Rework and quality not netted out | Business owner, finance |
| Decision-grade evidence | £1.5m | Before-and-after only, for a large commitment | Business owner |
On these figures, attribution coverage is £3m of £10m, 30%, if the test is "has a baseline and an outcome measure", or 15% if the test is decision-grade evidence. Both are legitimate. The point is to state which test you are using and divide by all identified AI spend, not by the spend you have already allocated. A coverage figure that quietly uses £8m as the denominator flatters the result by a quarter.
This is a house position, stated plainly. Attribution at task level is not technically impossible. It is organisationally uncomfortable, and most enterprises have chosen comfort over clarity. The evidence below shows the cost of that choice.
2. The evidence that the gap is real
Tier 1: On-the-record incidents
Uber. In May 2026, COO Andrew Macdonald told the Rapid Response podcast: "it's very hard to draw a line between one of those stats and 'okay now we're actually producing like 25% more useful consumer features'... That link is not there yet." This was weeks after the company spent its entire 2026 AI budget in four months. Uber is not an AI laggard. It has run machine learning in production for a decade. If the AI coding budget can outrun governance at Uber, the default assumption for every other large organisation should be that it is happening to them too, less visibly. Full case file analysis.
UK government Copilot evaluations. The Department for Business and Trade ran controlled trials of Microsoft 365 Copilot across multiple departments and published the findings in full. The conclusion: "no robust evidence that time savings are leading to improved productivity". Users reported time saved. Measured output did not change. The gap between self-reported benefit and measured outcome is the value gap at task level, and the UK trials are the exception that proves the rule: they ran baselines and control groups, which is why they could state the finding. Most organisations skip the baseline and accept the self-report.
Klarna's partial reversal. Klarna announced in early 2024 that its AI customer service assistant was doing the work of 700 full-time agents. By May 2025, the company's CEO had acknowledged that the cost focus reduced service quality and that Klarna was recruiting human agents again, particularly for complex cases. The initial announcement measured deflection. The reversal measured resolution quality and customer satisfaction. Benefits and costs landed in different ledgers, and the gap appeared when the ledgers were reconciled.
Tier 2: Surveys with sample sizes stated
Bain, 2026. Automation and AI Pathfinder Survey of 951 global companies. Bain's own report: nearly 40% of the companies that measured AI cost savings landed in the 0% to 10% range, although 37% had targeted 11% to 20%. 44% are funding the next AI wave from prior automation savings that have consistently come in below target, and 90% of those companies are increasing their budgets again. Bain's conclusion, verbatim: "The value didn't arrive." The 44% figure is particularly revealing: next year's budget justified by past savings that fell short. The gap does not stay still; it leverages.
KPMG scaling-versus-measurement gap. KPMG's 2025 research found organisations scaling AI faster than they are building the measurement systems to prove it works. The gap between deployment velocity and evidence velocity is the governance failure in survey form.
MIT NANDA 95%. MIT NANDA's 2025 report, The GenAI Divide, based on a review of more than 300 public initiatives, interviews with 52 organisations and a survey of 153 senior leaders, suggests failure rates remain extremely high. The 95% figure should be read with its method caveats: it includes pilots that were never intended to reach production, and "failure" is defined broadly. But even with those caveats, the directional finding is consistent with every other data source: most AI initiatives do not produce measurable returns.
Tier 3: The market's own behaviour
The Wall Street Journal reported in May 2026: "Corporate America Is Starting to Ration AI as Cost Skyrockets." A senior bank technology executive, quoted: "The free-money period for AI is definitively over."
Rationing is what organisations do when they cannot attribute. If the value were clear, the response to rising cost would be reallocation toward the highest-return uses, not rationing. The fact that rationing is the dominant response tells you the gap is real and wide.
New evidence: October 2026 review
Added 6 October 2026. Reported findings, each with its sample and caveats. They add to the Tier 2 evidence above. They do not change the argument.
State of Tokenomics, September 2026. The Tokenomics Foundation's survey (report, Release Candidate 1.0, 23 September 2026) has 472 responses across 11 industries, with 40% from technology and software. It asked about confidence connecting AI spend to a measurable business outcome that a CFO would accept: 39% were not confident, 34% slightly, 17% moderately and 9% very. Only 25% of those with highly confident spend visibility could do it. 43% named proving value or ROI as their biggest challenge, against 7% for cost or pricing complexity. 88% have a defined owner for AI economics. Those that do were 3.7 times more likely to show value to the CFO, and the 12% with no owner included none that could. Caveats: the sample is self-selected, the Foundation's members sell tooling, and the multipliers are correlations, not effects.
State of FinOps 2026. The FinOps Foundation's survey (data, published 19 February 2026, so earlier than the June cut-off of the evidence above but not previously cited here) reports that 98% of its 1,192 respondents now manage AI spend, up from 63% in 2025 and 31% in 2024. Many were asked to self-fund AI through optimisation savings. This measures who has been handed AI cost to manage. It does not measure whether value is proved.
IDC. Reporting on IDC research presented in April 2026 says only 7.5% of enterprises are embedding FinOps into AI projects (CIO Dive). This is a secondary report of analyst research.
Gartner on finance-function AI. A Gartner survey of 160 senior finance leaders (Gartner release of 24 September 2026, reported by CFO.com on 12 October) found 55% saw positive overall returns from their 2025 AI initiatives. At the level of individual use cases the picture is different: 57% had unclear returns, 18% positive, 19% negative and 6% broke even. A portfolio can report a positive return while most of its parts are unmeasured. Caveats: a small sample, finance functions only, and the Gartner release itself could not be read directly. Added 12 October 2026.
BCG Applied AI Index 2026. BCG reports that nearly half of companies now create value from AI, up from about 40% in 2024 and 2025, and that AI spending has roughly doubled to 3.3% of revenue, with more than 80% of it outside enterprise IT (BCG, 30 September 2026). Spend sitting outside IT is the same problem this page describes under invisible cost. Caveat: self-reported by 1,330 executives. Added 12 October 2026.
A counterweight. Some vendor-commissioned surveys report a larger share of organisations with significant AI return than the independent studies above. They carry a commercial interest and are best read as vendor research, not independent benchmarks. The studies also define return differently, which is itself a measurement problem.
Reading across them. More organisations are being asked to manage AI cost, and the standards for measuring it are maturing. The independent evidence still points the same way: knowing what AI costs is ahead of knowing what it produced. The people who can show value are disproportionately those with a named owner and metered, attributable spend.
3. Why the gap persists
Five mechanisms explain why the gap opens and why it is hard to close. Each gets one case-file anchor.
1. Budgets are licence-shaped; spend is consumption-shaped
Uber budgeted AI coding tools as if they were licences: size it annually, then push adoption. But the spend was metered and unbounded. A fixed budget and an instruction to maximise a metered variable is a fuse, not a governance model. Nobody would budget a fixed annual fuel cost and then run a leaderboard for miles driven, but that is the structure in most enterprise AI programmes today. Understanding Token Economics is essential for managing this metered consumption model.
2. No baseline before rollout, so no counterfactual after
The UK government trials are the exception. Most organisations roll out AI tools without capturing pre-rollout baselines for cycle time, throughput, or quality. Without a baseline, "maybe implicitly there's more that is getting shipped" - Uber COO Andrew Macdonald's actual words - is the strongest claim available. A company that measures everything about a ride could not measure this, because measurement was never designed in.
3. Benefits and costs land in different ledgers
Time saved accrues to individuals. Licence costs land in IT. Rework costs land in operations. Klarna's initial claim measured deflection (a customer service metric). The reversal measured resolution quality and satisfaction (different metrics, different owners). When benefits and costs are in different ledgers, the gap can persist for quarters before anyone reconciles them.
4. Incentives attach to usage, which destroys the data
Uber ran internal leaderboards ranking AI coding tool usage. Once usage is ranked, usage data stops telling you about productivity. Some unknown share of consumption becomes performative. The data you need to prove value is the data the incentive scheme destroyed. This pattern is reported across multiple organisations but requires validation in each case.
5. A growing share of AI cost is invisible by design
Microsoft bundles Copilot into Microsoft 365 renewals and raised consumer pricing by over 30% in some markets. Cursor repriced its coding assistant in June 2025, moving from flat to usage-based. AI cost is increasingly embedded in SaaS renewals and repriced mid-contract. The invoice is visible. The AI-attributable share is not, unless the buyer demands it in writing. This opacity makes AI TCO harder to calculate and value attribution nearly impossible.
4. Pricing the gap
A worked illustration, labelled hypothetical, in the currency a board uses.
A 10,000-person organisation. £6 million annual AI spend across copilots, coding tools, and embedded tiers. 20% attribution coverage - meaning 20% of spend is connected to a measured outcome with a named owner and a baseline. That leaves £4.8 million of spend that is, in audit terms, unevidenced.
Not necessarily wasted. Unevidenced. The board question is whether any other £4.8 million programme would survive that status.
The compounding version
44% of firms are funding the next AI wave from prior savings that came in below target
Bain's 2026 Automation and AI Pathfinder Survey (n=951). The gap does not stay still. It leverages. Next year's budget justified by past savings that fell short is the gap compounding.
This is a dated, falsifiable house position. Gartner forecasts that by 2030 inference on a trillion-parameter model will cost providers over 90% less than in 2025, and also says those savings will not be fully passed on to enterprise customers (Gartner, 25 March 2026). Agentic systems multiply tokens per task, and providers do not fully pass price declines through. Cheaper tokens, bigger invoices. This is Jevons paradox in the wild: efficiency improvements increase total consumption. The site can be held to this position. If total AI invoices fall in 2027 or 2028, this position was wrong.
5. Why "wait for prices to fall" is not a strategy
Gartner forecasts provider inference costs for a trillion-parameter model falling by over 90% between 2025 and 2030. That sounds like a reason to wait. It is not, and Gartner itself expects the savings not to be fully passed on.
Agentic systems multiply tokens per task. An agent iterating on a codebase resends growing context with every step. The marginal task is more expensive than the average task. Gartner also notes that agentic use cases need more tokens per task than generative ones.
Per-token prices fall. Total invoices rise. Anyone who ran cloud budgets through the 2010s has seen this movie. Waiting for prices to fall is not a strategy. It is a way to arrive at the same governance failure with a larger invoice.
6. Closing the gap: attribution coverage as an operating metric
Attribution coverage is the share of AI spend connected to a measured outcome. It is the headline metric the whole discipline improves over time. Here is how to compute it this quarter.
How to compute attribution coverage
- Inventory all AI spend. Direct consumption (API and token spend), licensed seats (copilots, coding assistants), embedded tiers (AI components inside SaaS contracts), infrastructure (GPU, hosting, model platform costs).
- Classify each line. Outcome-linked (a measured result exists, with a baseline and an owner), activity-linked (usage data only), unattributed (neither).
- Publish the ratio. Outcome-linked spend divided by total AI spend. That is attribution coverage, version one. A browser-based calculator does the arithmetic and stores nothing.
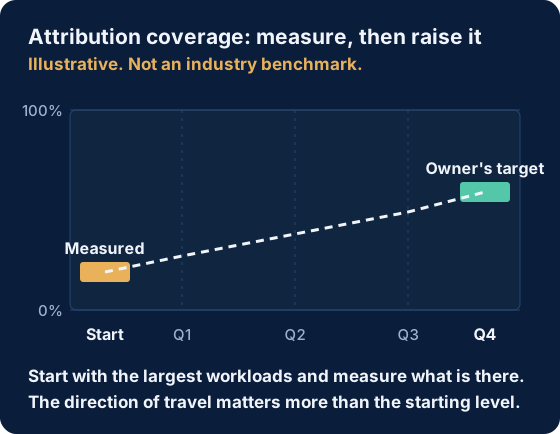
Version one is allowed to be embarrassing. Do not benchmark the starting percentage against an imagined industry average: there is no reliable one yet. Measure it, starting with the largest or riskiest workloads, and set a target trajectory that raises it quarter by quarter. The direction of travel and the quality of the evidence matter more than the starting level.
Who owns it
One named executive, not a committee. The owner needs authority to ask awkward questions across budget lines and to make stop, redesign, or scale decisions mid-year. Without a named owner, attribution coverage becomes a dashboard metric rather than a governance lever.
The four value dimensions
Each dimension has a metric that evidences it and a trap that fakes it.
1. Productivity. Metric: redeployed capacity (FTE hours reassigned to other work, measured). Trap: self-reported time saved (a claim, not evidence).
2. Cost avoided. Metric: baseline cost per unit of work, measured before and after, with adoption and quality held constant. Trap: deflection without resolution (Klarna's initial claim).
3. Revenue. Metric: incremental revenue isolated from other commercial changes, with a control group or time-series analysis. Trap: revenue growth during an AI rollout, attributed to AI without isolating its contribution.
4. Risk. Metric: incidents avoided, with a baseline rate and a mechanism that explains how AI reduced it. Trap: risk reduction asserted without showing what was avoided or how.
7. What to do in the next 30 days
A compressed pointer to the playbook. Five steps, each with a deliverable.
- Name an owner. One person accountable for AI economics across the estate, with a mandate letter from the CFO or CIO.
- Build the spend inventory. Every AI cost, in one register, in four categories: direct consumption, licensed seats, embedded tiers, infrastructure.
- Capture baselines for the top three use cases by spend. Whatever pre-AI history exists - cycle times, tickets resolved per FTE, drafting turnaround - capture now, before it ages out of systems.
- Define one unit cost per major use case. Cost per accepted code change; cost per resolved ticket; cost per document processed, fully loaded with review time.
- Hold the first value review and publish the pack. One hour, CFO or delegate in the room. Contents: total AI spend and trend; adoption versus seats; attribution coverage v1; top-three unit costs; three decisions.
Full playbook: The First 100 Days of AI Value Management, with month one set out week by week.
8. Where we might be wrong
The analysis presented here rests on three core assumptions that deserve scrutiny. First, that attribution at task level is both technically feasible and economically justified for most enterprise AI deployments. Second, that the gap between cost visibility and value evidence represents a governance failure rather than a temporary measurement lag that will resolve as AI matures. Third, that the disciplines proposed-baselines, unit costs, named owners-can scale across diverse AI use cases without creating prohibitive overhead.
Each assumption could be wrong in specific contexts. Small-scale experimentation may genuinely benefit from lighter governance until patterns emerge. Highly exploratory AI research initiatives may resist standardised measurement frameworks. And some AI capabilities-particularly those that enhance decision quality rather than automate tasks-may require fundamentally different value proof approaches than the productivity-focused methods emphasised here.
The strongest challenge to this framework comes from organisations that have achieved genuine AI value without formal attribution systems. If such cases exist at scale and can be documented, they would suggest that the Value Gap analysis overweights measurement discipline relative to other success factors such as executive sponsorship, technical capability, or organisational readiness. The framework should be tested against those counterexamples and refined accordingly.
9. The call to action
The next phase of enterprise AI will be defined less by model access and more by management discipline. Organisations that close the AI Value Gap earliest will not simply reduce waste. They will create a more credible basis for sustained investment, faster reallocation, and stronger trust between finance, technology, and business leaders.
The four questions remain straightforward:
- What are we really spending?
- Who owns the economic result?
- What proof standard governs the next tranche of scale?
- Which initiatives deserve more capital, less capital, or redesign?
Organisations that can answer those questions consistently are not just measuring AI better. They are governing it better.
Related reading
Token Economics
Understand the fundamental unit of AI cost and how metering shapes consumption patterns and value attribution.
AI ROI Models
Move from broad claims of usefulness to explicit return dimensions, timelines, and proof standards.
AI TCO Framework
See how full cost visibility should be structured across platform, model, people, and operating overhead.
FinOps for AI
Apply operational governance practices to manage AI consumption and prove value at scale.
SaaS Token Opacity
How bundled AI pricing in SaaS contracts creates visibility gaps that undermine value attribution.
Uber AI Budget Case Study
Full case file analysis of how Uber spent its 2026 AI budget in four months and what AI Value Management would have done differently.
The First 100 Days of AI Value Management
How to start: a week-by-week first month, then a sequence to a first portfolio review and board pack. Month one needs only finance extracts, vendor portals and a spreadsheet.