

Key takeaways
- Engineering leaders now influence AI economics directly through model routing, prompt design, workflow architecture, and platform choices.
- The strongest engineering AI strategies treat cost per feature, cost per user, and cost per action as real delivery metrics, not finance afterthoughts.
- Prompt engineering, caching, and selective model choice can create meaningful savings without damaging product value when designed intentionally.
- Build-versus-buy decisions should be judged on total operating burden, not only on provider price or hosting cost.
Engineering is now shaping the denominator
For many engineering leaders, AI still enters the roadmap as a capability question. Can the model do it? Can the workflow support it? Can the feature launch on time? Those questions matter, but they are no longer enough. In AI-heavy systems, engineering also shapes the economic denominator. Interpretation That is because cost is now influenced directly by design decisions. Model choice, prompt construction, context size, fallback logic, tool orchestration, retry patterns, observability, and cache policy all shape what the organisation pays each time the feature is used. Interpretation In classic software delivery, cost and architecture were connected. In AI systems, the connection is tighter and more immediate. InterpretationEngineering cost visibility matters: Uber spent its entire 2026 AI coding budget in four months, and the COO could not draw a line between usage and value. The visible API invoice ran $500-$2,000 per engineer per month, but the hidden costs - review time of engineers checking agent-generated code, rework when agent-committed code needs correction, orchestration engineering - never appeared on the Anthropic invoice but belong in cost per unit of shipped work.
Model selection is an economic decision
Engineering teams often treat model choice as a quality or latency trade-off first. It is also a financial choice. Interpretation Premium models may be right for some steps in a workflow, but wasteful for others. Smaller or more specialised models may be sufficient for routing, classification, extraction, or basic drafting work. Interpretation The practical question is not "which model is best?" It is "which model is good enough for this step, at this quality bar, with this cost envelope?" That is a more durable engineering posture because it reflects what enterprise AI services actually become: repeated operating commitments, not one-off demonstrations. InterpretationPrompt engineering as cost optimisation
Prompt engineering is sometimes treated as a user-interface craft or a quality-tuning exercise. It is also a cost lever. Interpretation Overlong prompts, repeated system context, weak structuring, and poor tool-use instructions can all create avoidable spend. Interpretation That does not mean prompts should be optimised only for brevity. The point is to design prompts that produce the required output quality with the minimum viable context and orchestration complexity. Done well, prompt engineering reduces both cost and unpredictability. Done poorly, it allows workflow waste to hide behind model capability. InterpretationBuild versus buy versus fine-tune
Engineering leaders are often asked to recommend whether to buy a packaged AI capability, build with APIs, fine-tune commercial models, or pursue open-weight self-hosting. The mistake is to compare these options on provider price alone. Interpretation A better decision frame asks: Interpretation- How differentiated is the workflow?
- How much control, observability, and sovereignty is actually required?
- What internal platform and support burden does each option create?
- How sensitive is the feature to inference cost at scale?
- What is the likely marginal cost of adding more users, tasks, or product surfaces later?
When AI agents fail economics: Starbucks retired its inventory management AI agent after discovering the system's recommendations were being routinely overridden by store managers who understood local context the model missed. The agent consumed resources but delivered no measurable improvement over human judgement. The retirement decision came only after establishing baseline performance metrics - a discipline engineering leaders must build into deployment decisions from the start.
Shift-left cost awareness for developers
AI cost governance arrives too late if developers only learn about it when finance reports a budget variance. Engineering teams need earlier feedback. Interpretation That means cost estimation should appear during design review, architecture review, and feature planning. Teams should know the likely unit-cost range of a workflow before it launches. They should also know which design choices are expected to keep that range under control. Interpretation Shift-left cost awareness does not mean asking every engineer to become a finance specialist. It means giving teams enough context that wasteful default choices are less likely to ship. InterpretationTrivial-task gaming: Amazon's internal AI usage reportedly included significant volumes of trivial-task gaming, where employees used AI tools for low-value work to meet adoption targets or demonstrate engagement. The pattern emerged only after usage telemetry was analysed by task type and outcome, not just volume. Engineering leaders must design telemetry that distinguishes productive use from performative use.
Useful engineering KPIs for AI economics
Classic engineering KPIs are still relevant, but they are not sufficient on their own. AI-heavy systems often need a slightly wider set of measures. Interpretation Recommended metrics include: Interpretation- Cost per inference
- Cost per action
- Cost per feature
- Cost per active user or workflow
- Cache hit rate
- Percentage of workflow steps routed to premium models
- Quality-adjusted unit cost
BCG's six technology use-case families
BCG's Q2 2025 study of 1,250 companies identified six prominent technology function use-case families where AI is being deployed at scale: software development, data management, compliance monitoring, IT programme and project management, service desk automation, and technology sourcing. Legacy modernisation is emerging as a seventh high-value category. Interpretation Each family has distinct economics. Engineering leaders should understand these patterns to set realistic expectations and appropriate measurement frameworks. Interpretation1. Software development
Current state: Around two-thirds use AI in the software development lifecycle, with about 36% at scaled or full deployment. Current productivity improvement is reported around 25%, with higher expected improvement at full scale.
Economics: Value comes from faster feature delivery, but only if review burden, rework, and quality are managed. The task-to-business-value chain is: code generation → review and correction → integration and testing → deployment → adoption → business outcome. Value can be lost at any step.
Key metrics: Review-to-generation ratio, change failure rate, rework rate, deployment frequency, lead time, escaped defects
2. Data management
Current state: AI is used for data profiling, classification, lineage tracking, quality validation, and metadata enrichment.
Economics: Value is often indirect. Better data management enables faster use-case delivery, improved model quality, and lower compliance risk. Direct cost reduction is harder to demonstrate.
Key metrics: Data discovery time, quality improvement, compliance coverage, manual effort avoided, time to deploy new use cases
3. Compliance and security monitoring
Current state: AI analyses logs, validates policies, detects anomalies, generates audit trails, and tests controls.
Economics: Regulatory and risk-driven. Value includes avoided penalties, faster audits, and reduced manual control effort. Cost must be justified against risk exposure, not only efficiency.
Key metrics: Coverage percentage, detection accuracy, false positive rate, time to detection, audit efficiency, control cost per transaction
4. Service desk automation
Current state: AI handles incident deflection, first-contact resolution, and knowledge retrieval. Examples show lower handling time and higher first-contact resolution.
Economics: High volume, low complexity. Value comes from scale, not individual transaction quality. Requires continuous quality monitoring to prevent degradation.
Key metrics: Deflection rate, deflection quality, first-contact resolution, cost per resolved ticket, escalation rate, user satisfaction
5. Technology sourcing
Current state: AI assists with RFP drafting, vendor research, contract analysis, and knowledge retrieval.
Economics: Episodic rather than continuous. Value comes from faster, better-informed decisions rather than transaction volume. Requires integration with procurement systems and knowledge bases.
Key metrics: Sourcing cycle time, contract quality, knowledge reuse, analyst productivity, decision quality
6. Legacy modernisation
Current state: One case reports analysis of 3.1 million lines of code and more than 5,000 business rules in under three weeks, with dramatic reduction in estimated effort.
Economics: High upfront cost with long-term value. Business case should include immediate delivery savings, avoided future maintenance, risk reduction, platform simplification, and improved change velocity. Requires explicit decommissioning milestones to realise value.
Key metrics: Analysis time, migration effort, decommissioning progress, risk reduction, future change velocity, avoided maintenance cost
The 5% scale problem: BCG reported that only about 5% of companies in its 2025 technology-function study were generating measurable AI value at scale. Around 60% reported no material value, while 35% were scaling and seeing some return. This suggests that technology function AI is expanding rapidly but value realisation remains concentrated among early adopters with mature execution models. Engineering leaders should not use high productivity ranges without including this scale warning.
The task-to-business-value chain
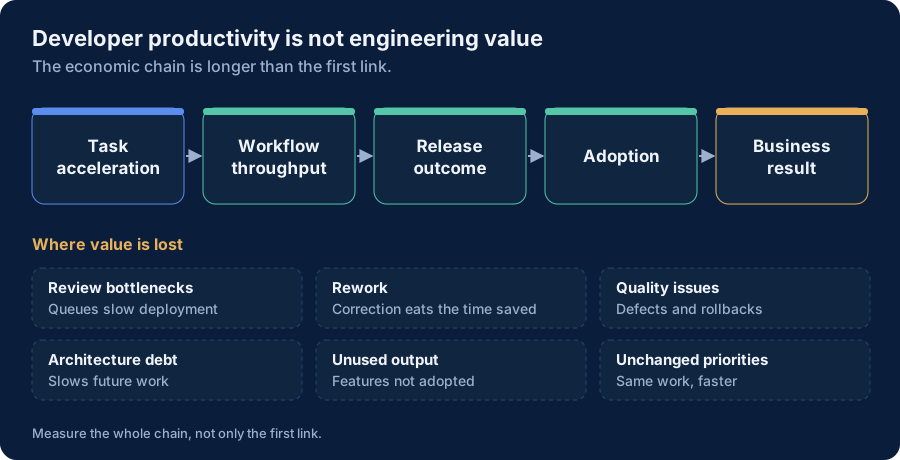
Engineering leaders often measure AI productivity at the task level: code generated, tickets deflected, documents drafted. But task productivity is not business value. The economic chain is longer: InterpretationTask acceleration → Workflow throughput → Release outcome → Adoption → Business result
Value can be lost at every step: Interpretation- Review bottlenecks: AI generates code faster, but review queues slow deployment
- Rework: AI outputs require correction, consuming the time saved
- Quality issues: Defects, rollbacks, or security findings create downstream cost
- Architecture debt: Fast generation creates technical debt that slows future work
- Unused output: Features ship but are not adopted
- Unchanged priorities: Faster delivery does not change what gets built
Current versus expected-at-scale distinction
BCG's technology-function research mixes current productivity and expected full-scale improvement. These categories must remain separate. Interpretation Engineering leaders should chart AI value as: Interpretation- Observed current outcome: What is actually happening now
- Expected scaled outcome: What is projected at full adoption
- Confidence range: The uncertainty in the projection
- Assumptions required for conversion: What must change to reach the scaled outcome
Model routing and small-model economics
IBM's late-2025 Enterprise 2030 survey found that around 72% of executives expect smaller language models to become more prominent than large language models in their organisations by 2030. Organisations expecting more tailored model portfolios also expect stronger productivity, margin, and cycle-time improvements than those relying mainly on large pre-trained models. Interpretation Model routing is the practice of directing different tasks to different models based on complexity, quality requirements, latency needs, and cost constraints. Premium models for complex reasoning, smaller models for classification and extraction, specialised models for domain-specific tasks. Interpretation The economics are compelling: a 10x cost difference between models means routing 80% of tasks to smaller models can reduce total inference cost by 70-80% if quality remains acceptable. But routing adds orchestration complexity, monitoring burden, and potential quality inconsistency. InterpretationReal routing economics (May 2026): Inferbase's May 2026 analysis, citing Artificial Analysis provider data, shows the input list price for one 70B open model (Llama 3.3 70B) ranging from $0.10 to $0.90 per million tokens across hosting providers, a 9x spread before caching, output ratios, rate tiers and side-charges are counted. This means routing decisions must account for more than headline per-token rates. Engineering leaders should model fully loaded cost per task, not just API rate cards, when designing routing strategies.
Review, quality, security, and downstream capacity costs
AI-generated outputs create review burden. The faster AI generates, the more review capacity is required. If review capacity is constrained, AI does not accelerate delivery-it creates a queue. Interpretation Quality costs include rework, defect remediation, rollbacks, security findings, and technical debt. These costs are often invisible in initial productivity claims but become material at scale. Interpretation Security costs include scanning AI-generated code, validating AI decisions, monitoring for data exposure, and auditing AI behaviour. These costs grow with deployment scale and regulatory requirements. Interpretation Downstream capacity costs are the hardest to see. If AI accelerates one part of the workflow but creates bottlenecks elsewhere (testing, deployment, support, documentation), the overall cycle time may not improve. Engineering leaders must measure end-to-end flow, not isolated task speed. InterpretationReuse and technology velocity measures
McKinsey's late-2025 survey of 632 C-level and senior technology leaders found that top-performing companies are more advanced in product and platform operating models. Nearly one in ten report full adoption across all technology teams, more than four times the rate of other organisations. Interpretation Technology velocity is the rate at which an organisation can convert an AI hypothesis into trustworthy operating evidence. It depends on: Interpretation- Time from idea to funded experiment
- Time from approved use case to first production user
- Time from production release to measurable outcome
- Percentage of components reused across use cases
- Percentage of portfolio spend redirected within a quarter
- Decision latency for data, risk, security, and architecture approvals
- Learning cost per validated or rejected hypothesis
What product and engineering should align on
AI economics goes wrong quickly when product teams optimise for feature availability whilst platform teams optimise for infrastructure efficiency and finance reviews the result after the fact. A better model creates shared design intent. Interpretation Product should define which outcomes actually matter. Engineering should design workflows that meet those outcomes within a realistic economic envelope. Finance and FinOps should provide the unit-cost signals that make trade-offs visible early. InterpretationThe optimist's case
Engineering leaders are best positioned to own AI economics because they control the design decisions that create cost. BCG's research on the AI value gap shows that organisations with strong technical leadership in AI governance close the gap faster. The FinOps Foundation's 2025 guidance emphasises that AI cost management must extend beyond infrastructure to include model, data, and governance costs - all areas where engineering has direct influence.
The sceptic's case
Engineering leaders lack the financial authority and cross-functional visibility to own AI economics effectively. Finance owns budgets, business units own outcomes, and engineering owns delivery - splitting AI economics across these functions creates accountability gaps. Market observations of enterprise Copilot subscription cancellations in early 2026 suggest that engineering enthusiasm for AI tools does not automatically translate to business value, which is why business and finance leadership is essential.
Synthesis · house view
AI economics requires shared ownership with clear role separation. Engineering owns design decisions that influence unit economics and total cost of ownership. Finance owns budgets, forecasting, and portfolio-level trade-offs. Business units own outcome definitions and value realisation. The critical success factor is not who owns AI economics, but whether these three functions align on measurement, accountability, and decision rights before capital is committed.
The practical conclusion
AI economics for engineering leaders is not about turning product development into spreadsheet management. It is about recognising that architecture and workflow design now shape recurring unit economics more directly than many software teams are used to. Interpretation Engineering leaders who understand that shift will make better build-versus-buy decisions, set better product constraints, and help their organisations scale AI capabilities that remain useful when scrutiny increases. InterpretationReferences and further reading
Related reading
BCG, The Widening AI Value Gap: Build for the Future, 2025
Research on why organisations struggle to capture AI value and how technical leadership influences outcomes.
FinOps Foundation, FinOps for AI: Scopes and Capabilities, 2025
Guidance on extending FinOps disciplines to AI cost management, including model, data, and governance costs.
AWS, Closing the AI Value Gap, 2024
Enterprise strategy guidance on connecting AI investment to measurable business outcomes.
Fortune, Uber COO: AI spending on tokens like Claude Code is hard to justify, 26 May 2026
Case study of engineering AI cost visibility challenges at enterprise scale.
BCG: How AI is paying off in the technology function
Research on AI deployment across six technology use-case families with current and expected-at-scale productivity data
IBM: The enterprise in 2030
Executive expectations for model portfolios, smaller language models, and technology velocity through 2030
McKinsey: Global Tech Agenda 2026
Research on product and platform operating models, intelligence layers, and technology velocity as competitive differentiators
AI TCO Framework
The seven-layer cost stack for enterprise AI, showing where engineering decisions influence total cost of ownership.
FinOps for AI
How FinOps disciplines extend to AI cost governance, with engineering-specific guidance.
Five-Level AI Economics Maturity Model
How organisations move from fragmented AI activity to governed, provable, portfolio-level AI value.