

The problem in one sentence
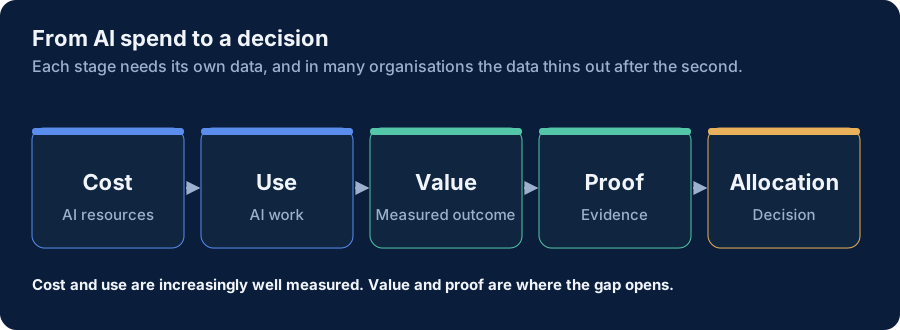
There is a gap between what organisations spend on AI and the share of that spend they can connect to a measured outcome. That difference is the AI Value Gap. Cost data tends to be automatic and timely. Value data tends to be manual, delayed and contested. Many leaders can say what they spent last month far more confidently than what they gained.
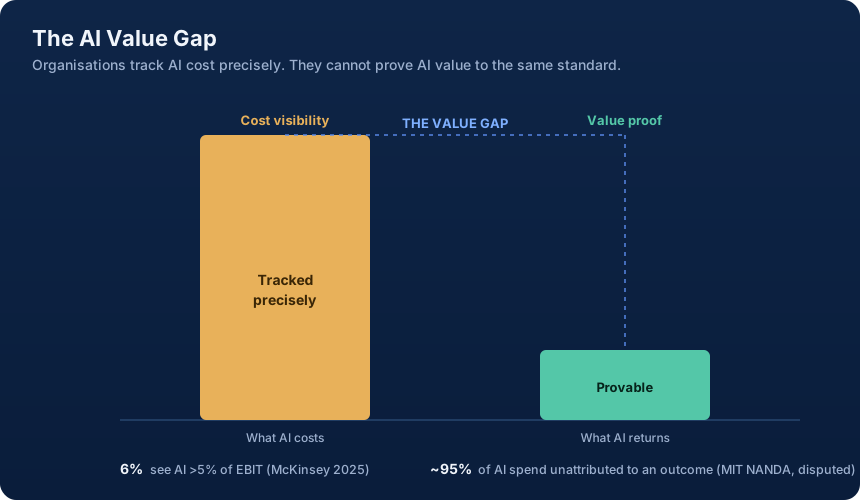
PwC’s 2026 survey of 4,454 chief executives found 56% reporting no significant financial benefit from AI so far, and 12% reporting both cost and revenue gains. Bain’s 2026 survey of 951 companies found that nearly 40% of those measuring AI cost savings landed at 0 to 10%, although 37% had targeted 11 to 20%. See the key numbers for sources and caveats.
Why cheaper AI does not close the gap
As generating work gets cheaper, the limit on value moves from the model to people: the capacity to review, correct and absorb what AI produces. AI output that looks finished but is not costs someone hours to fix, and that cost rarely appears in the business case. A case that prices the tokens but not the review capacity overstates value.
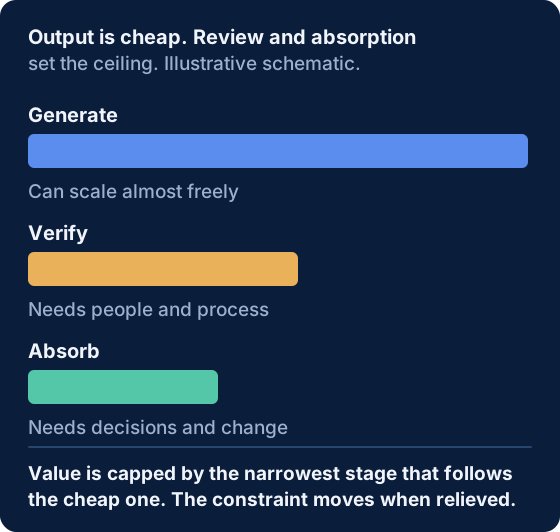
This is the site’s most distinctive argument, set out in The AI Abundance Paradox and priced in The Cost of Verification.
The one number to lead with
From spend to decision: four phases, eight steps
The AI Economics System turns the argument into a working routine. Each phase answers one question and hands its output to the next.
- Phase 1MeasureWhat does AI fully cost, where is it consumed, and who owns it?01See the costEvery AI cost line, including seats, embedded SaaS tiers and platform.02Name the workloadAttach the cost to a piece of work with an owner.
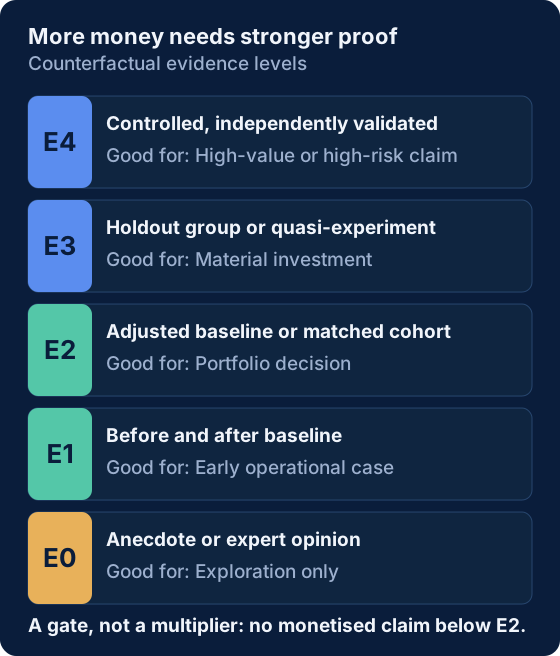
- Phase 2ProveWhat changed because AI was used, and how strong is the evidence?03Measure the outcomeAgainst a baseline, counting only outputs that clear the quality floor.04Net out the cost createdReview, rework, escalation and harm.05Judge the evidenceAnecdote, before-and-after, matched comparison or controlled trial.
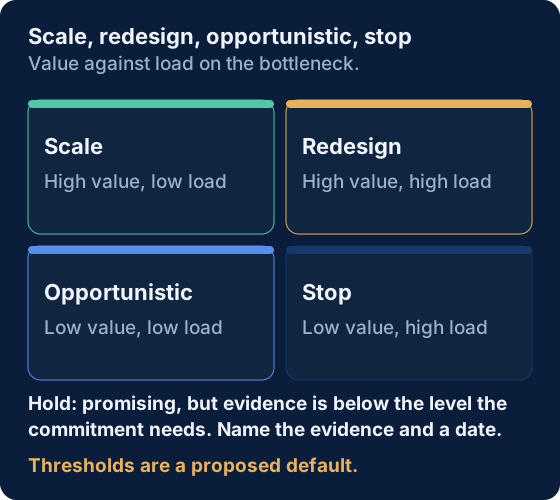
- Phase 3DecideGiven the economics and the evidence, what should be scaled, held, redesigned or stopped?06Compare full cost with valueIncluding verification and the platform the workload relies on.07DecideScale, hold, redesign or stop, with an owner and a date.
- Phase 4OperateWho owns each part, how often is it reviewed, and what reaches the board?08Check the decisionAt the next review, was it right? Adjust the rules if not.
Where this site sits
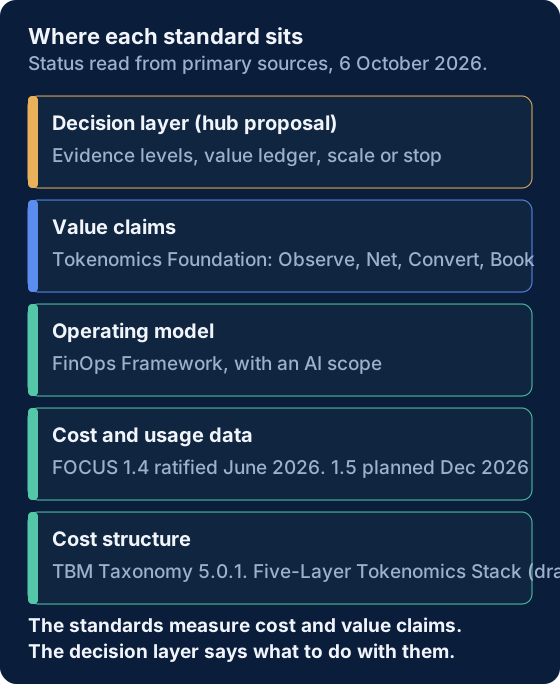
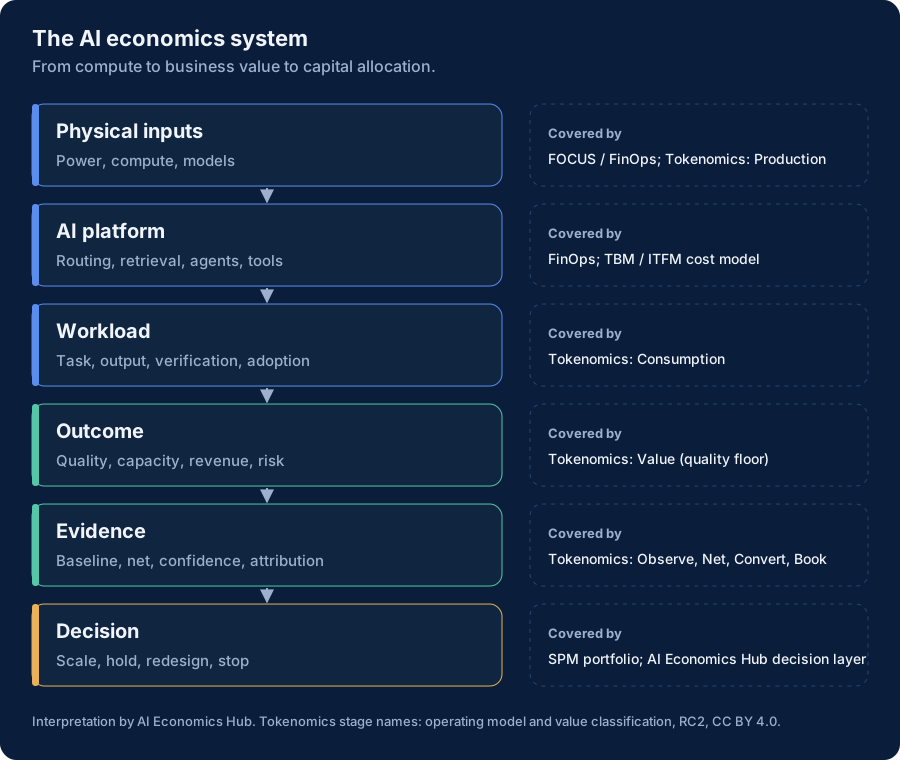
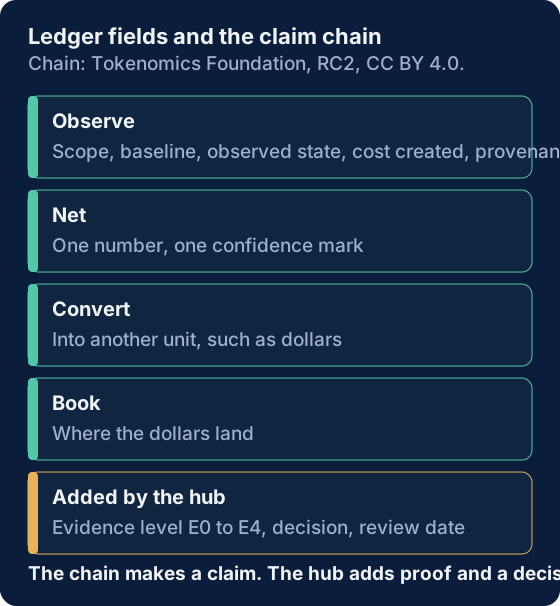
Cost and value measurement are being standardised by bodies such as the FinOps Foundation and the Tokenomics Foundation, whose value classification sets out how to build a value claim. This site focuses on the management layer above that evidence: how leaders compare claims, account for scarce human capacity, and decide what to fund, redesign or stop. The standards map shows where each body’s work ends and this site’s proposals begin.
Our position, stated plainly
We read the gap as mainly a governance problem rather than a measurement impossibility. Organisations already measure hard things, including marketing attribution and cyber risk. AI has not yet been given the same discipline.
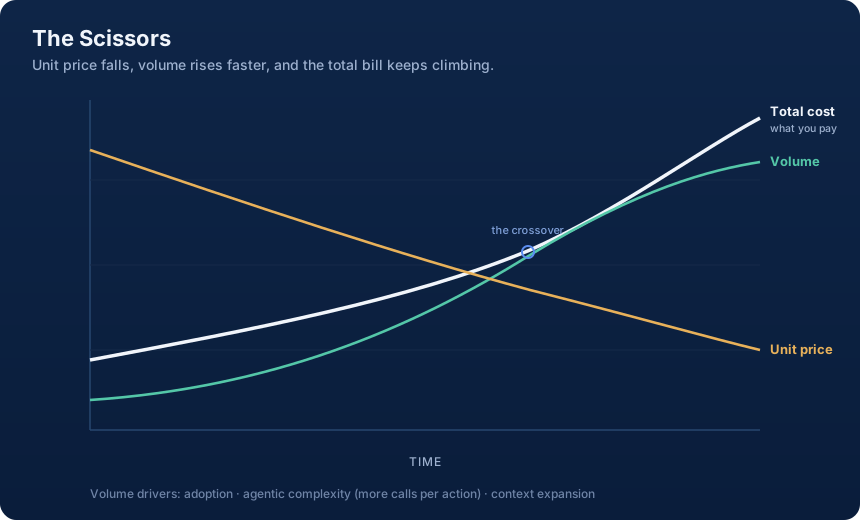
Waiting for prices to fall is not a budget plan. Per-token prices are falling, but agentic systems multiply the tokens used per task, and new uses appear as access gets cheaper. Our expectation is that total AI bills keep rising for some time even as unit prices drop. How to budget for AI shows how to plan for that.
Time saved is not the same as financial value. Some saved time is absorbed by review and rework, some is too fragmented to redeploy, and some becomes extra output rather than lower cost. A credible value claim shows what happened to the released capacity instead of multiplying saved hours by salary.
What to do first
You can start with finance extracts, vendor portals and a spreadsheet. In the first 30 days:
- Name one owner accountable for AI economics, with a mandate from the CFO or CIO.
- Build one spend inventory in four categories: direct consumption, licensed seats, embedded tiers inside SaaS contracts, and infrastructure.
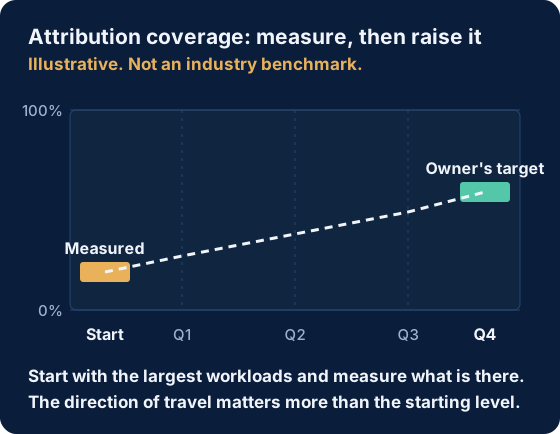
- Capture baselines for the top three use cases by spend, before that history ages out of your systems.
- Define one unit cost per major use case, fully loaded - for example, cost per resolved ticket or per accepted code change.
- Hold a first value review with finance in the room, publish the pack, and make three decisions: one tool to consolidate, one use case to baseline properly, one contract to renegotiate.
The toolkit has working templates for these steps, each with a worked example:
- AI TCO worksheetExcel worksheet · Measure
- Attribution coverage calculatorBrowser tool · Prove
- AI Value LedgerExcel template · Prove
To see the system applied, the decision cases follow 4 illustrative workloads to a scale, hold, redesign or stop call, with the cost, claimed value and evidence level behind each.
Where to go next
- Reference explainerThe AI economics mapOne map from compute to business value to capital allocation, showing where external standards stop and decisions begin.
- Hub proposalv0.9The AI Value GapWhy AI cost is visible and AI value is not, and how attribution coverage measures the difference.
- Hub proposalv0.5The AI Value LedgerOne record per material workflow: owner, baseline, cost, evidence level and a decision. With a template.
- Hub proposalv0.5Scale, hold, redesign, stopDecision rules that combine return on scarce capacity with the strength of the evidence.
The four questions a leader should be able to answer
What are we really spending on AI, in full?
Who owns the economic result?
What proof standard governs the next tranche of scale?
Which initiatives deserve more capital, less, or a redesign?
Organisations that can answer these are not just measuring AI better. They are governing it better.
Read next