

Key takeaways
- Forrester expects open-weight models to carry half of enterprise AI tokens in 2027 but only 5% of enterprise AI spend. The figures look surprising and follow directly from the price spread between model tiers.
- Per-token prices across one provider's own list run from $0.50 to $50 per million output tokens, a hundredfold range. When prices differ that much, the share of tokens tells you almost nothing about the share of spend.
- Moving more volume to cheap models has diminishing returns. Once the cheap tier is most of the tokens and little of the bill, the remaining spend sits in a few workloads on frontier models, and that is where cost reviews should start.
- Report tokens, spend and successful outcomes by model tier side by side. Each answers a different question, and none of them alone shows value.
The forecast
As reported by The Register on 21 October 2026, Forrester expects open-weight models such as Gemma, Llama and Qwen to account for half of enterprise AI tokens next year but only 5% of enterprise AI spend. Forrester sees them as sufficient for high-volume work such as document processing, customer support and internal knowledge search, with proprietary frontier models kept for a small number of high-stakes tasks where errors are costly (The Register).
The direction is consistent with what buyers report. In McKinsey's 2026 State of AI survey, about one in five respondents said AI operating costs, including tokens, constrained their use of AI (McKinsey, 25 August 2026). Moving volume to cheaper models is the obvious response.
What was measured in 2026
Menlo Ventures has since published a measured split for US enterprises, from a Morning Consult survey of nearly 400 decision-makers fielded in September 2026. Open-source models handled about one in five tokens (19%, up from 11% a year earlier) but about one in 25 dollars of model spend (4%, down from 6%), after a 3.3 times fall in their average token price. Frontier models moved the other way: their share of spend rose from 35% to 63% and their share of tokens from 18% to 42% (Menlo Ventures, 3 November 2026).
The two sources are not measuring the same thing. Forrester's figures are a forecast for 2027 across enterprise AI generally, reported second-hand. Menlo's are survey results for 2026 among US enterprises. Read together they agree on the mechanism, a cheap tier carrying a far larger share of tokens than of spend, and disagree on direction: in Menlo's data, frontier models gained share of both tokens and spend over the year. So far, buyers have moved some volume to cheaper models while moving more of their hardest work, and their money, to the frontier. The arithmetic below holds either way. Interpretation Spend is also concentrated by supplier: Menlo estimates that Anthropic, OpenAI and Google take 69% of enterprise AI deployment spend (register entry ER100). Added 5 November 2026.
Why the numbers separate
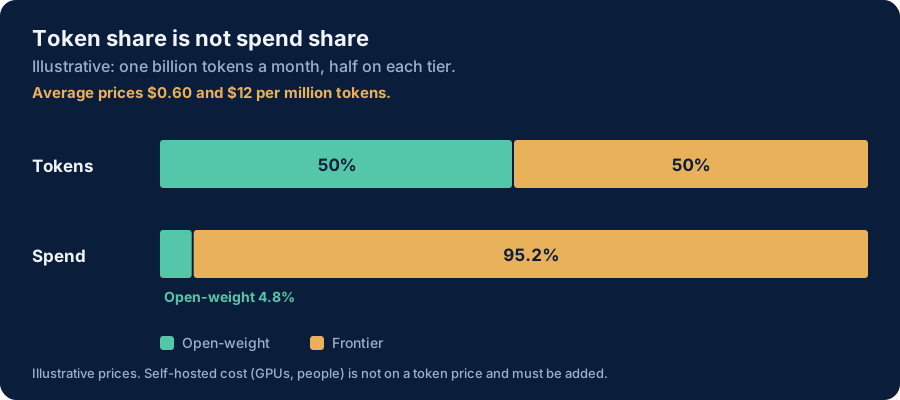
The split follows from price. Illustrative figures, not survey data: an organisation runs one billion tokens a month, half on open-weight models at an average of $0.60 per million tokens and half on frontier models at an average of $12 per million.
| Tier | Share of tokens | Tokens a month | Average price per million | Monthly cost | Share of spend |
|---|---|---|---|---|---|
| Open-weight | 50% | 500 million | $0.60 | $300 | 4.8% |
| Frontier | 50% | 500 million | $12.00 | $6,000 | 95.2% |
| Total | 100% | 1 billion | $6.30 blended | $6,300 | 100% |
Half the tokens cost under 5% of the bill. With a twentyfold price ratio between tiers, that is simple arithmetic, and real price lists span more than that. One major provider's own list runs from $0.50 to $50 per million output tokens (see What AI Actually Costs).
What it changes for cost management
Savings from shifting volume run out
In the example, moving another 10% of all tokens from frontier to open-weight models saves about $1,140 a month, 18% of the bill. Moving the next 10% saves the same again, but there is less frontier volume left to move each time, and the work left on frontier models is the work least able to move without failing the quality floor. Most of the remaining spend becomes a question about a few high-stakes workloads, not about routing policy.
The blended price misleads
As volume moves to the cheap tier, the average price per token falls. A falling blended price looks like cost control. It says nothing about the total, which can still rise if overall volume grows faster. This is the pattern behind this publication's house position that total AI invoices will keep rising regardless of unit prices.
Self-hosted tokens are not as cheap as their price
Open-weight tokens served by a provider carry a per-token price. Self-hosted ones do not. Their cost sits in GPUs, idle capacity and the people who run them, and it does not appear on a token report at all. A token share for self-hosted models should be paired with the fully loaded cost from the self-hosting break-even calculator, or the cheap tier will look cheaper than it is.
Value per token differs by tier
A token on a frontier model reviewing a contract and a token on a small model classifying an email are not the same unit of work. Comparing tiers by cost per token rewards moving work to the cheapest model whether or not it still succeeds. Compare them by cost per successful outcome, including the cost of fixing failures.
What to report
For each model tier, report four figures for the same period:
- Tokens, the measure of volume.
- Spend, fully loaded, including hosting and people for self-hosted models.
- Successful outcomes, the work that cleared the quality floor.
- Cost per successful outcome, spend divided by successful outcomes.
The first two show where volume and money sit. The last two show whether the routing is working. Organisations that route between models are more likely to say they can show value to the CFO: the Tokenomics Foundation found model router users four times as likely to do so, though that is a correlation, not an effect (register entry ER11). The report above is how a router's results can be checked.
Sources
- The Register, "AI will eat a fifth of tech budgets in 2027, but don't expect it to pay for itself", 21 October 2026. Reports Forrester's 2027 predictions and State of AI Survey 2026.
- Forrester, "Forrester's 2027 Technology And Security Predictions: AI Will Account For 20% Of All Business Technology Spend", 21 October 2026.
- Menlo Ventures, "2026: The State of Enterprise AI", 3 November 2026. Investor research; Menlo Ventures is an investor in Anthropic.
- McKinsey, "The state of AI in 2026: On the road to ROI", 25 August 2026.
- Tokenomics Foundation, "State of Tokenomics", Release Candidate 1.0, 23 September 2026.