Skip to content

AI Economics Lab Free Beta

Model the economics. Record the evidence. Make the next decision.

A working space for the questions that come before and after an AI investment: what a use case will really cost, how it compares with the alternatives, and what evidence stands behind the spend.

No account. Nothing you enter leaves this browser unless you export it.

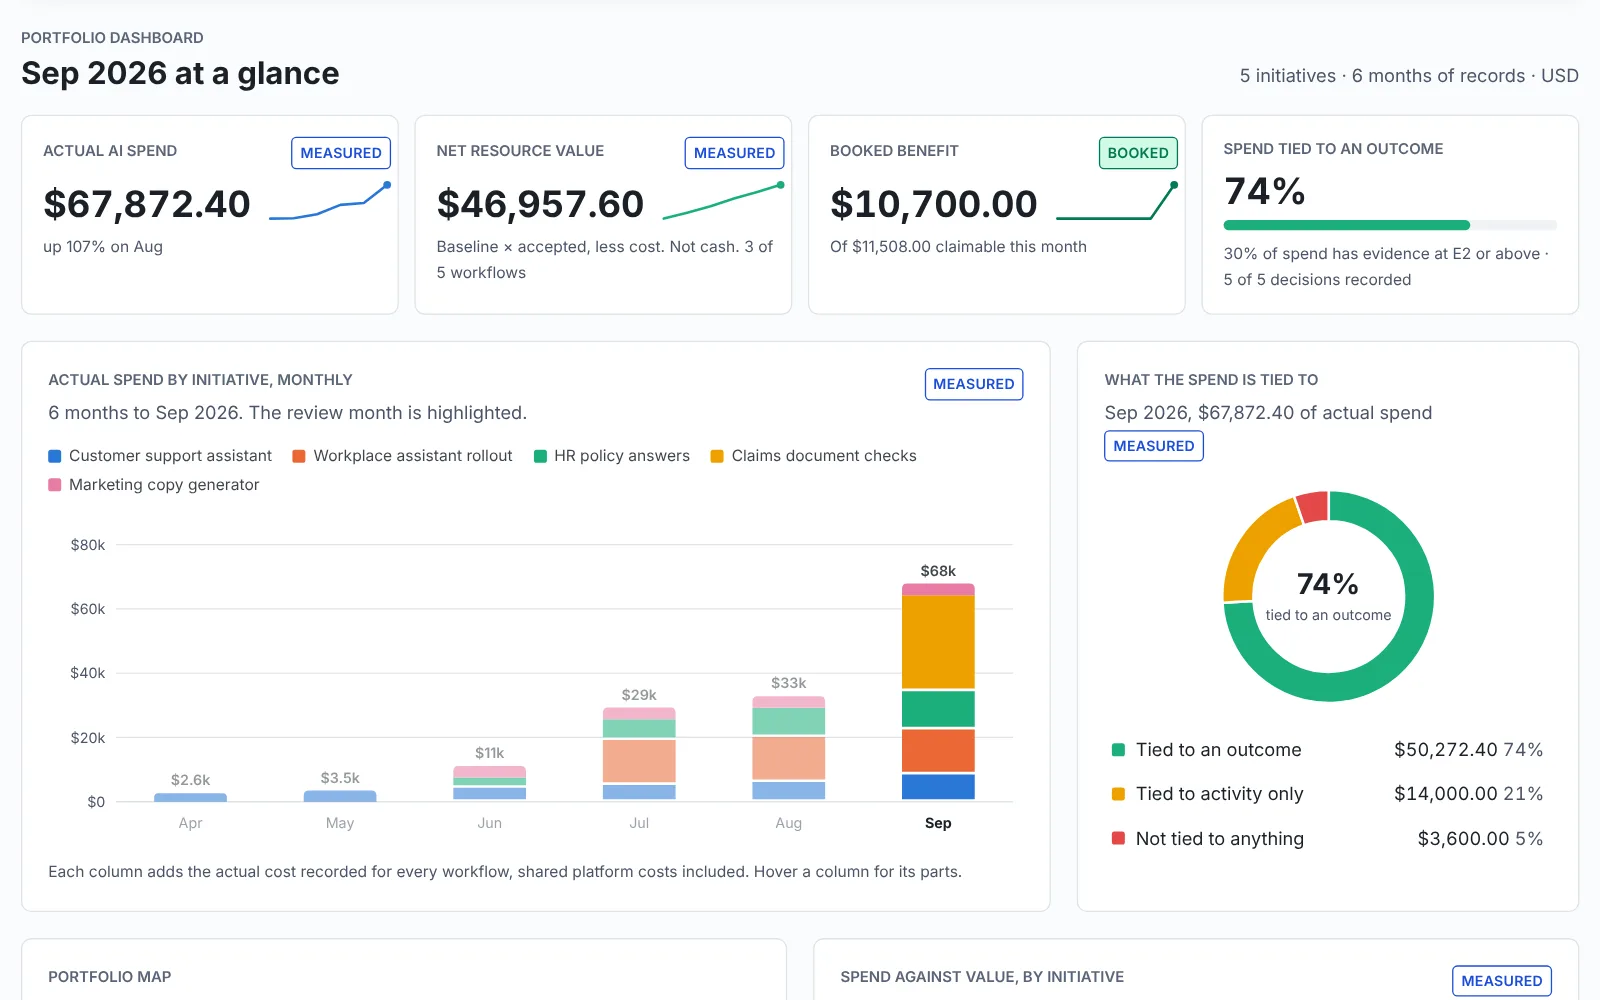
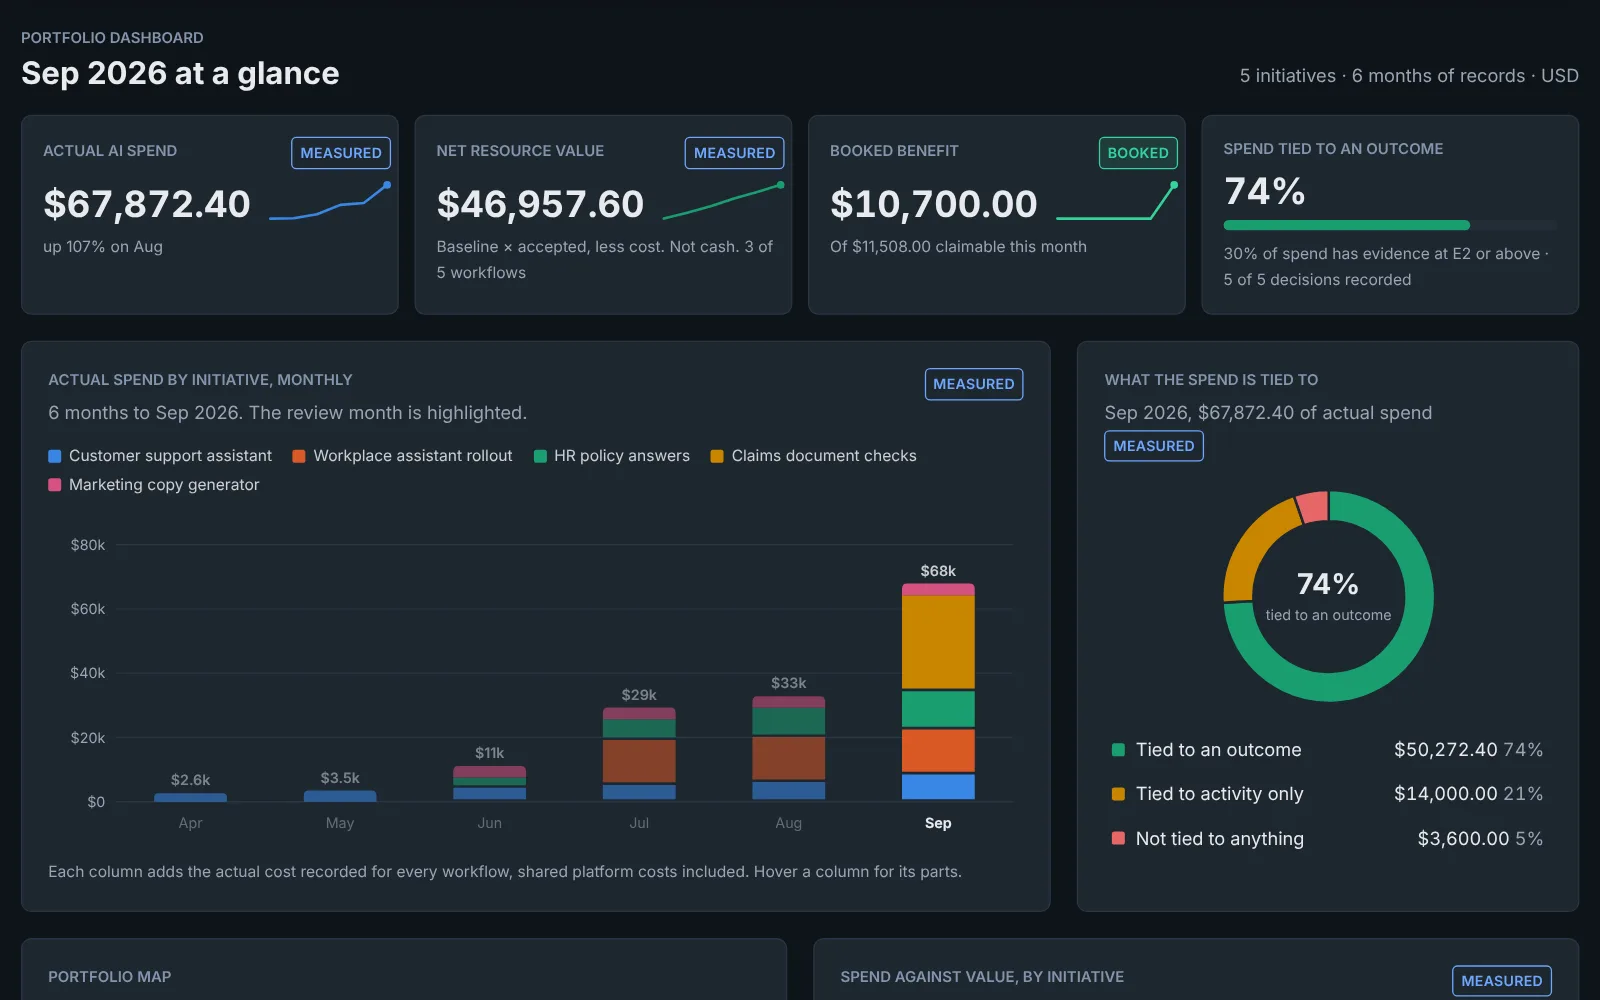
The Lab's portfolio dashboard for an invented month: actual AI spend, net resource value, booked benefit and the share of spend tied to an outcome, above charts of spend by initiative.
Prepare a review: the portfolio dashboard from the demo. Every figure in the demo is invented.
  • Finance and investment leads testing a business case before it is approved.
  • FinOps and TBM practitioners putting AI spend on the same footing as the rest of technology cost.
  • Use case owners who need a figure they can defend at review.

Tasks

Start with the decision in front of you

Each task answers one question, and all four are ready to use. They share one set of definitions, formulas and evidence levels, written down before any screen was built: read the methodology.

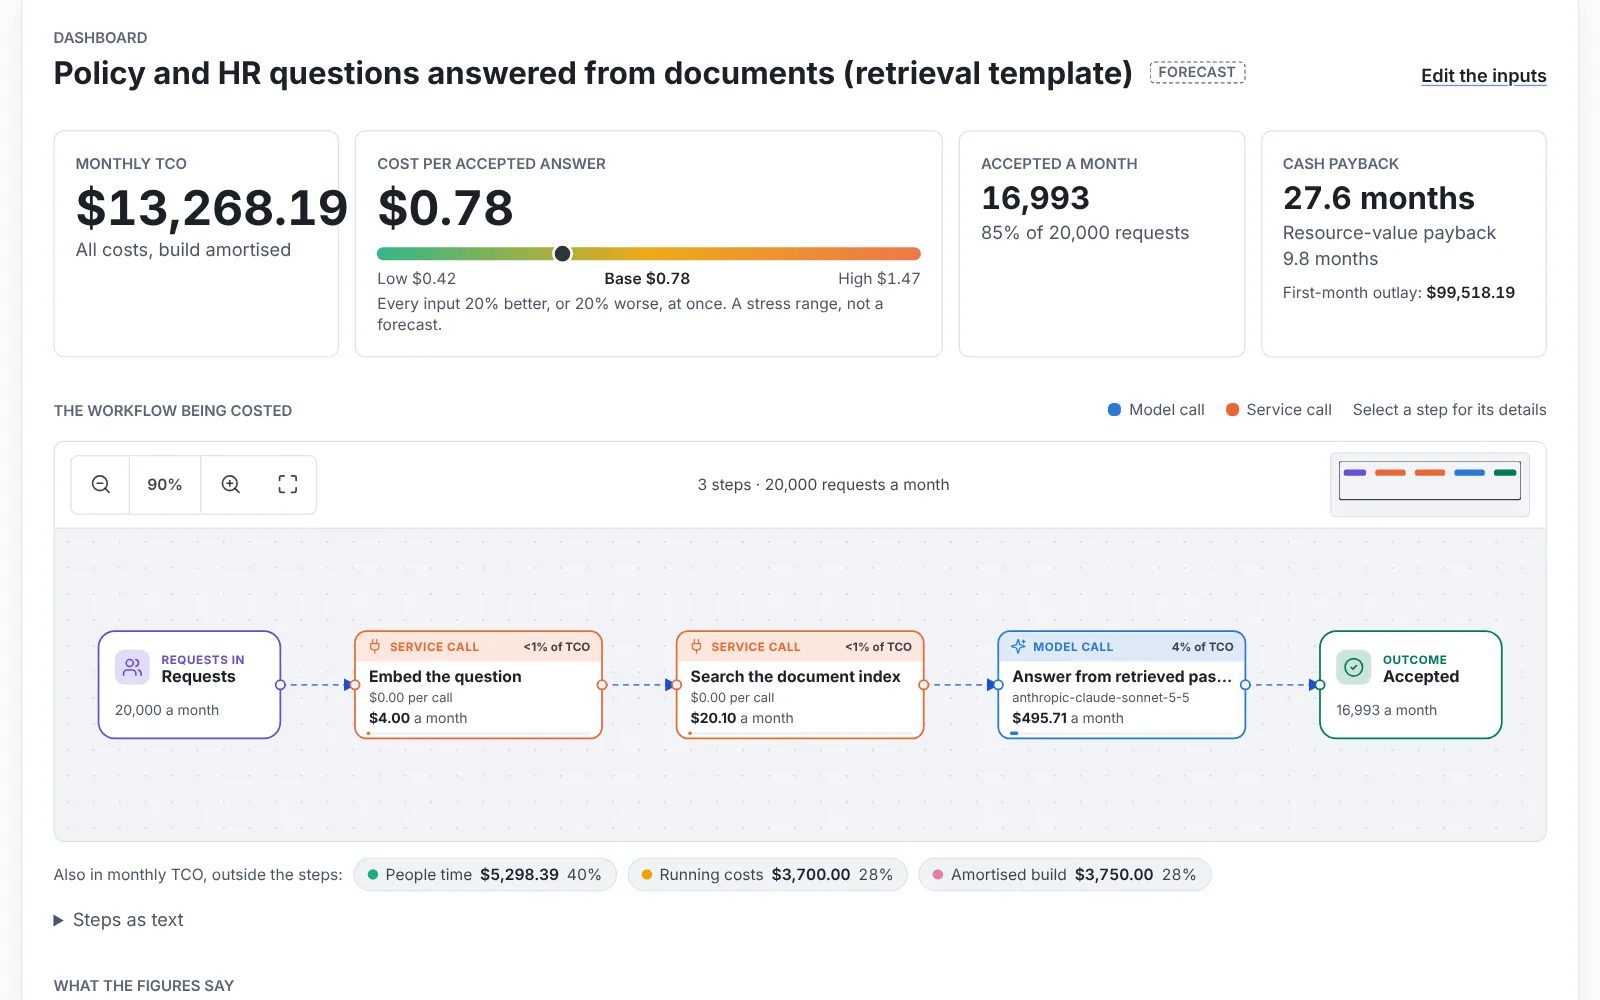
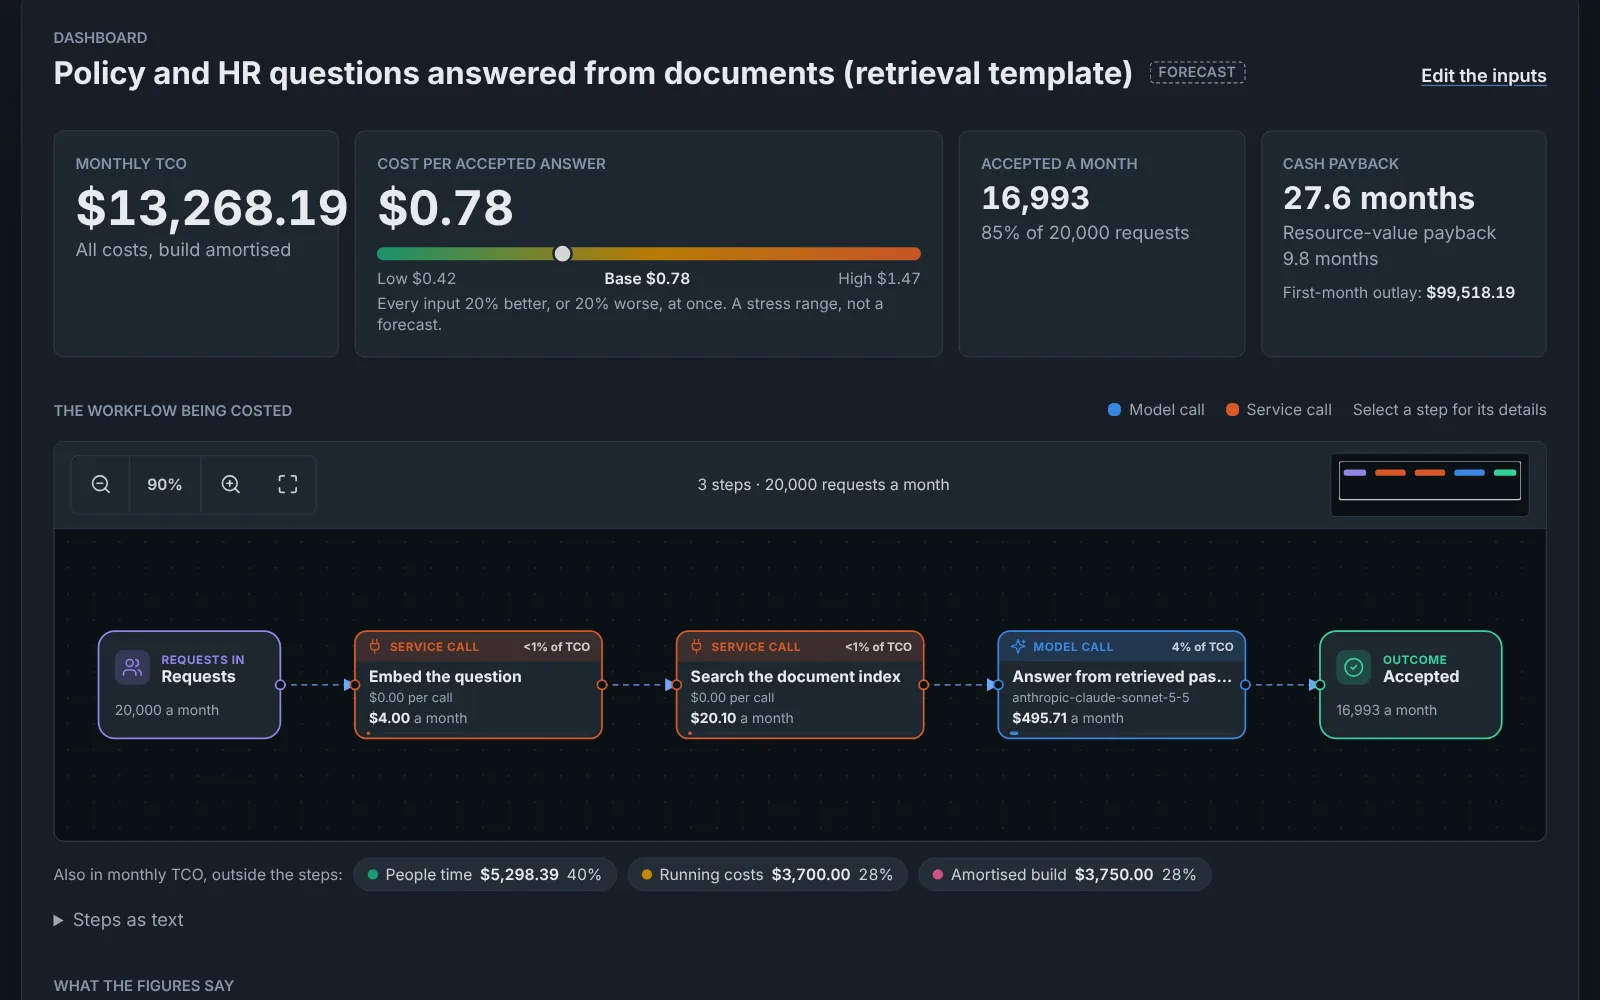
  • The custom workflow estimate: a diagram of the workflow, headline cost tiles and cost by category.

    What does this use case really cost for each piece of work it completes?

    Cost one use case on the path that fits it: a packaged tool, a custom workflow on model APIs, or a choice between pay-per-token and dedicated capacity.

    • Monthly TCO and first-month outlay
    • Cost per accepted outcome
    • Cash and resource value, with payback

    Read on the Hub: AI TCO Framework

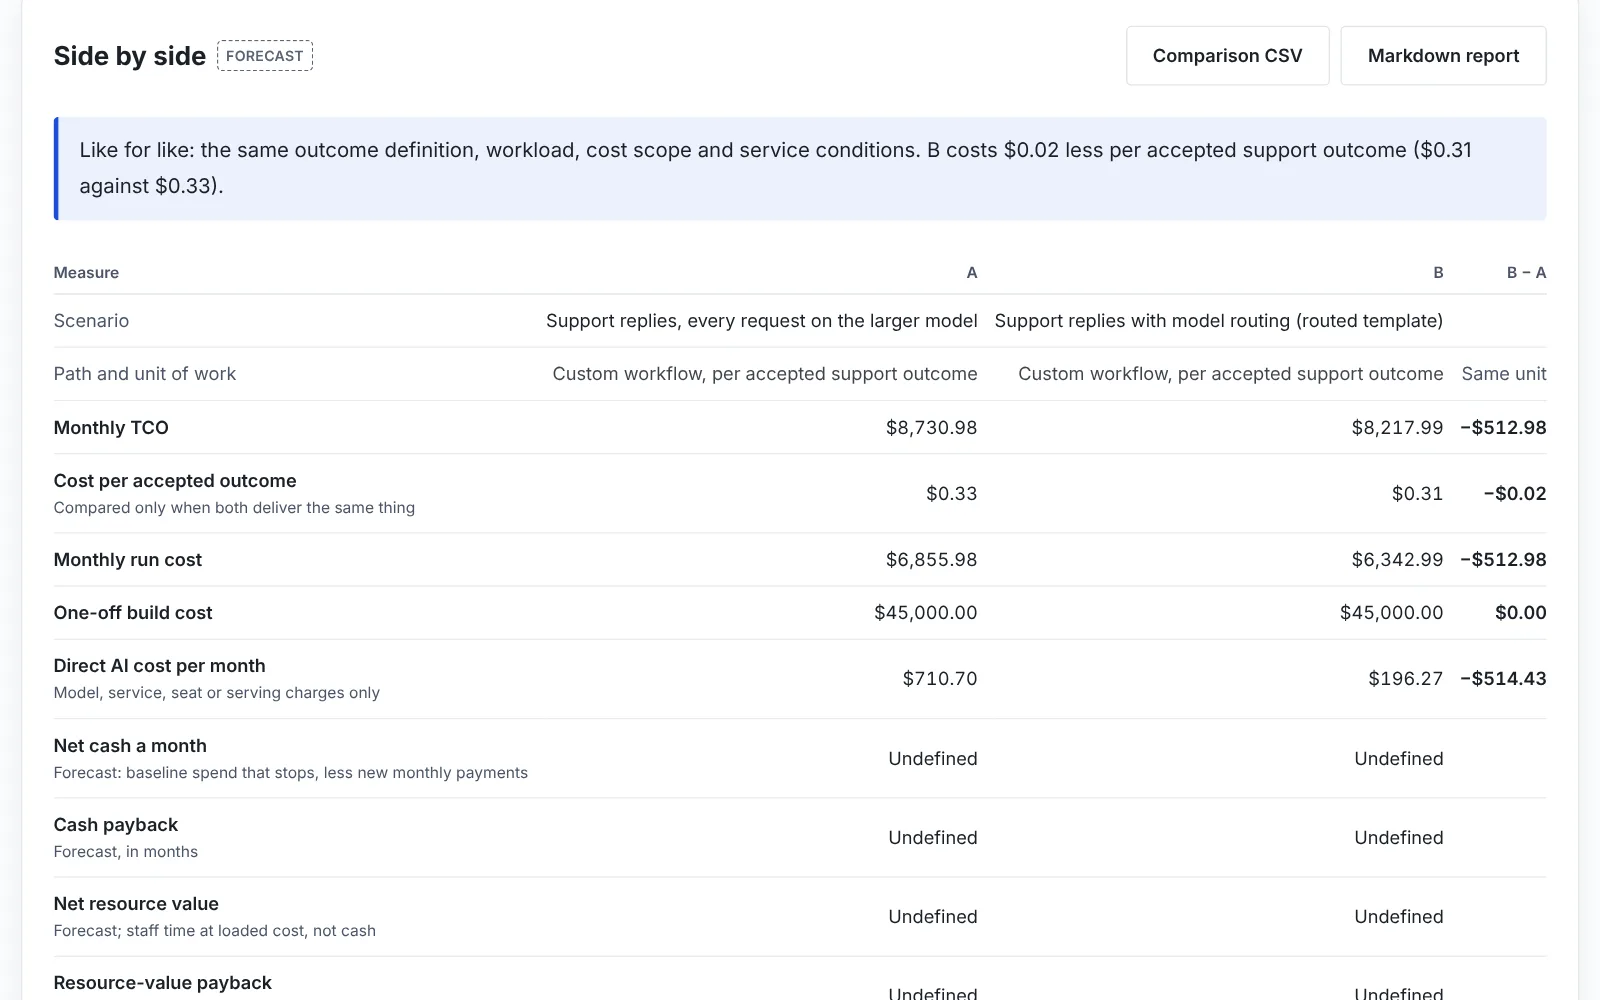
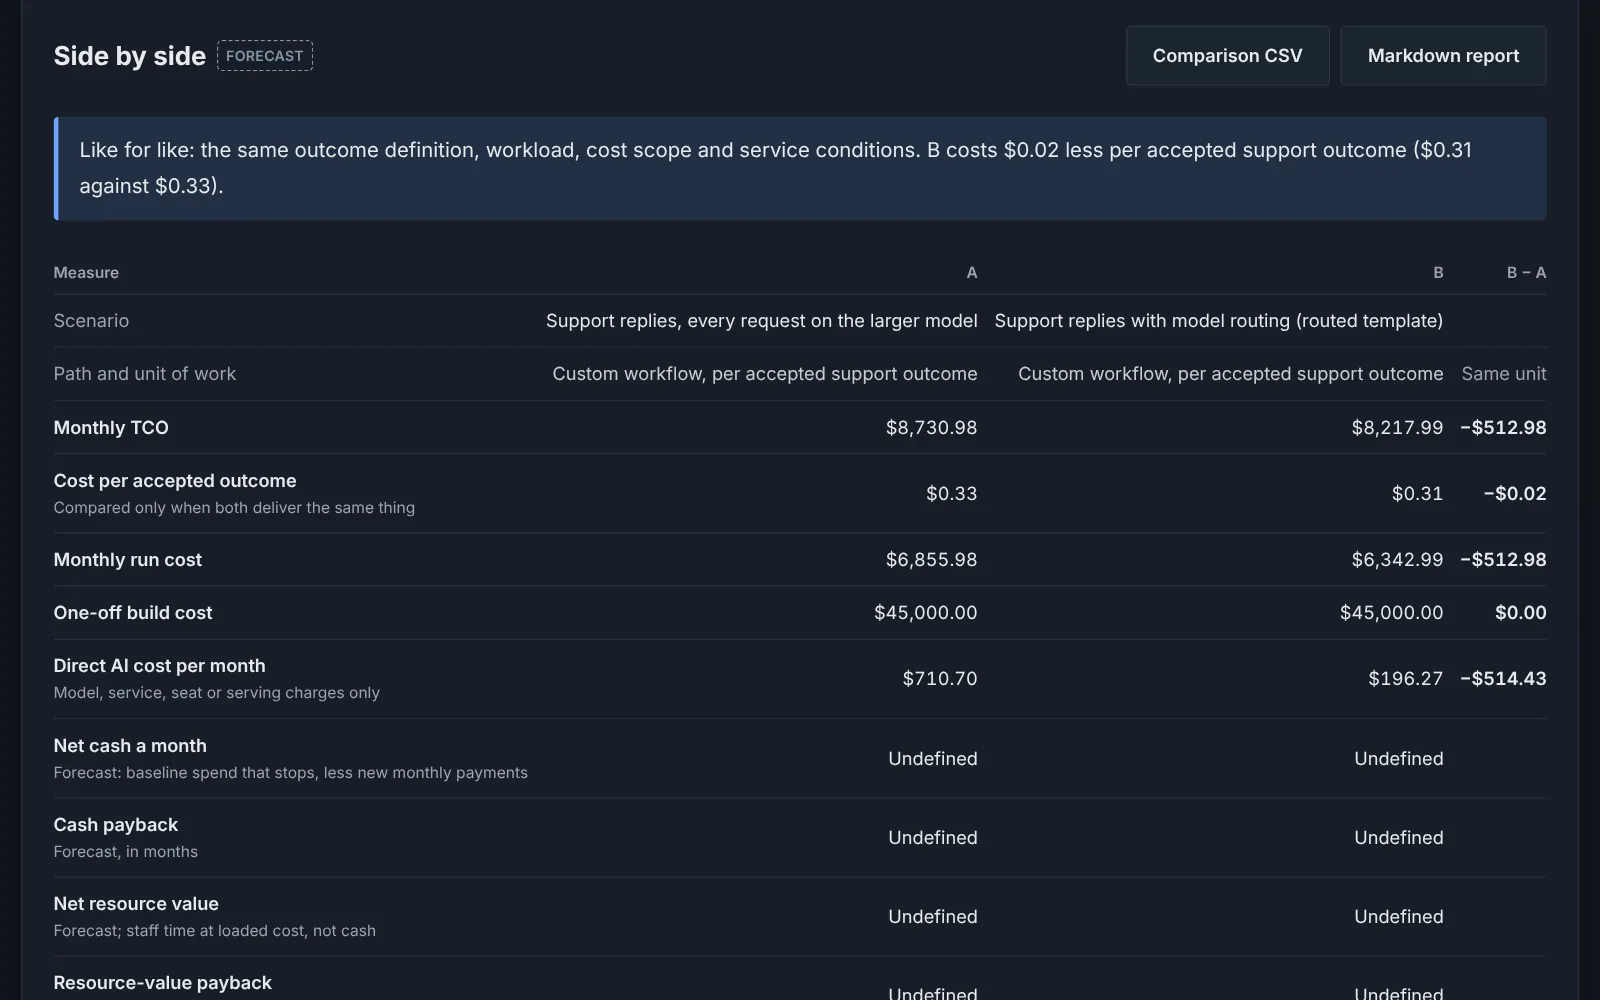
  • Two saved estimates side by side, with the cheaper option named on cost per accepted outcome.

    Which option is cheaper for the same work, and what would change the answer?

    Put two scenarios side by side on the same unit of work, then see which assumptions move the result most.

    • Side-by-side scenarios
    • Sensitivity ranking
    • Export to JSON or CSV

    Read on the Hub: Self-Hosting Break-Even Calculator

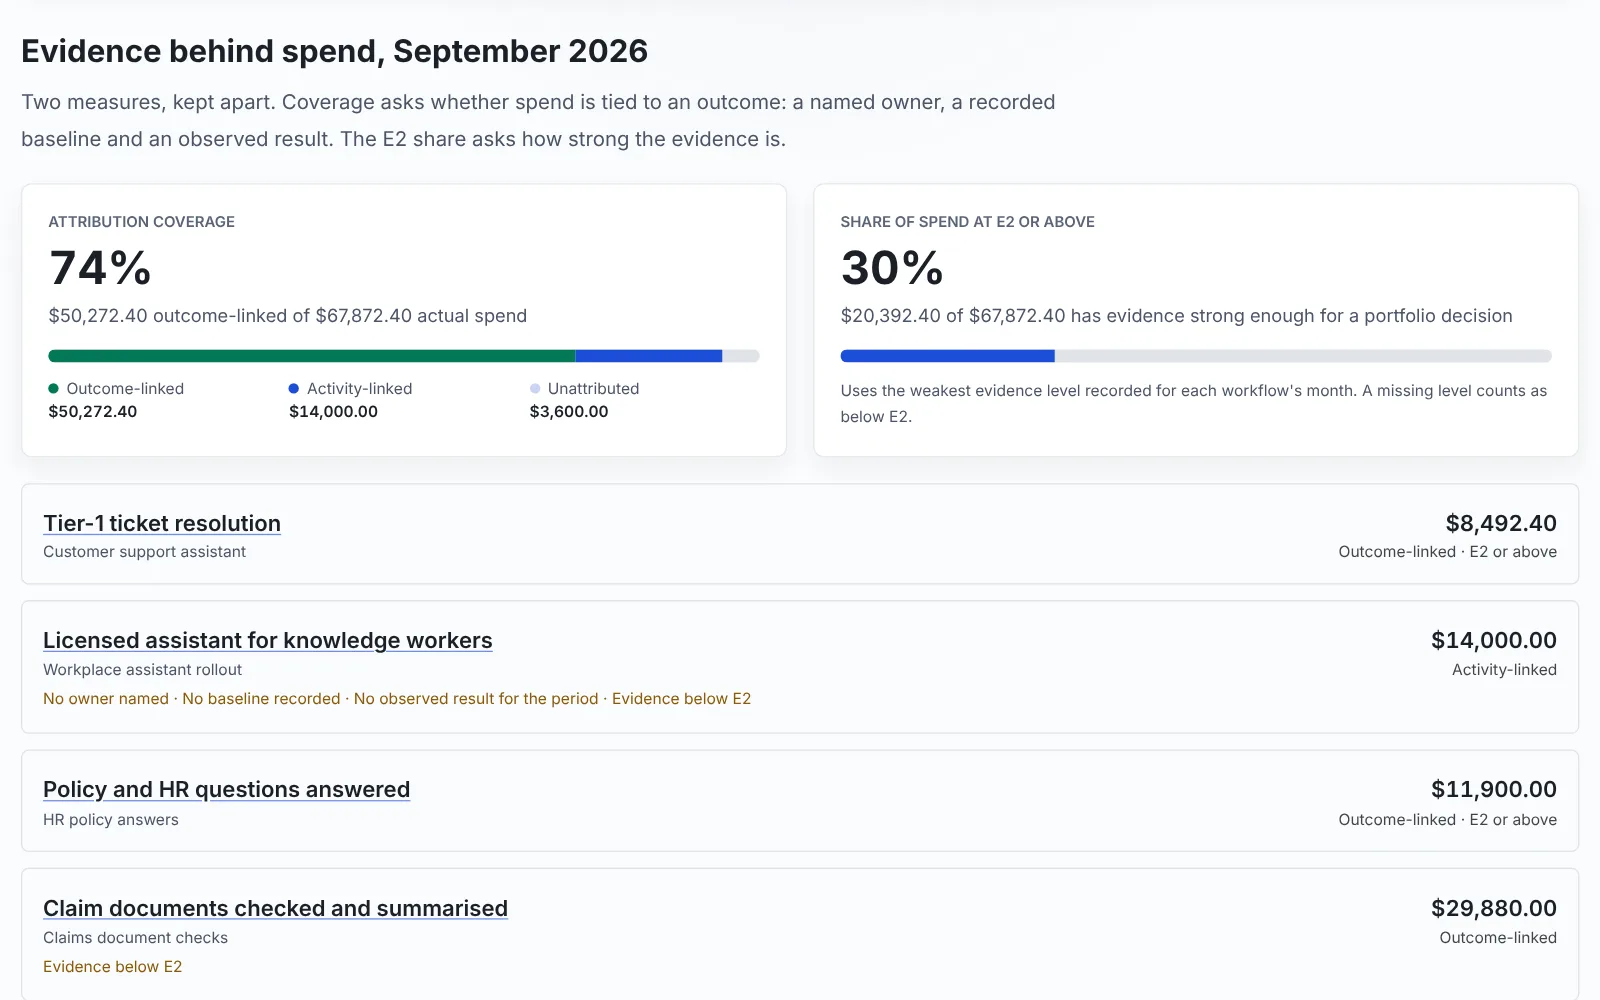
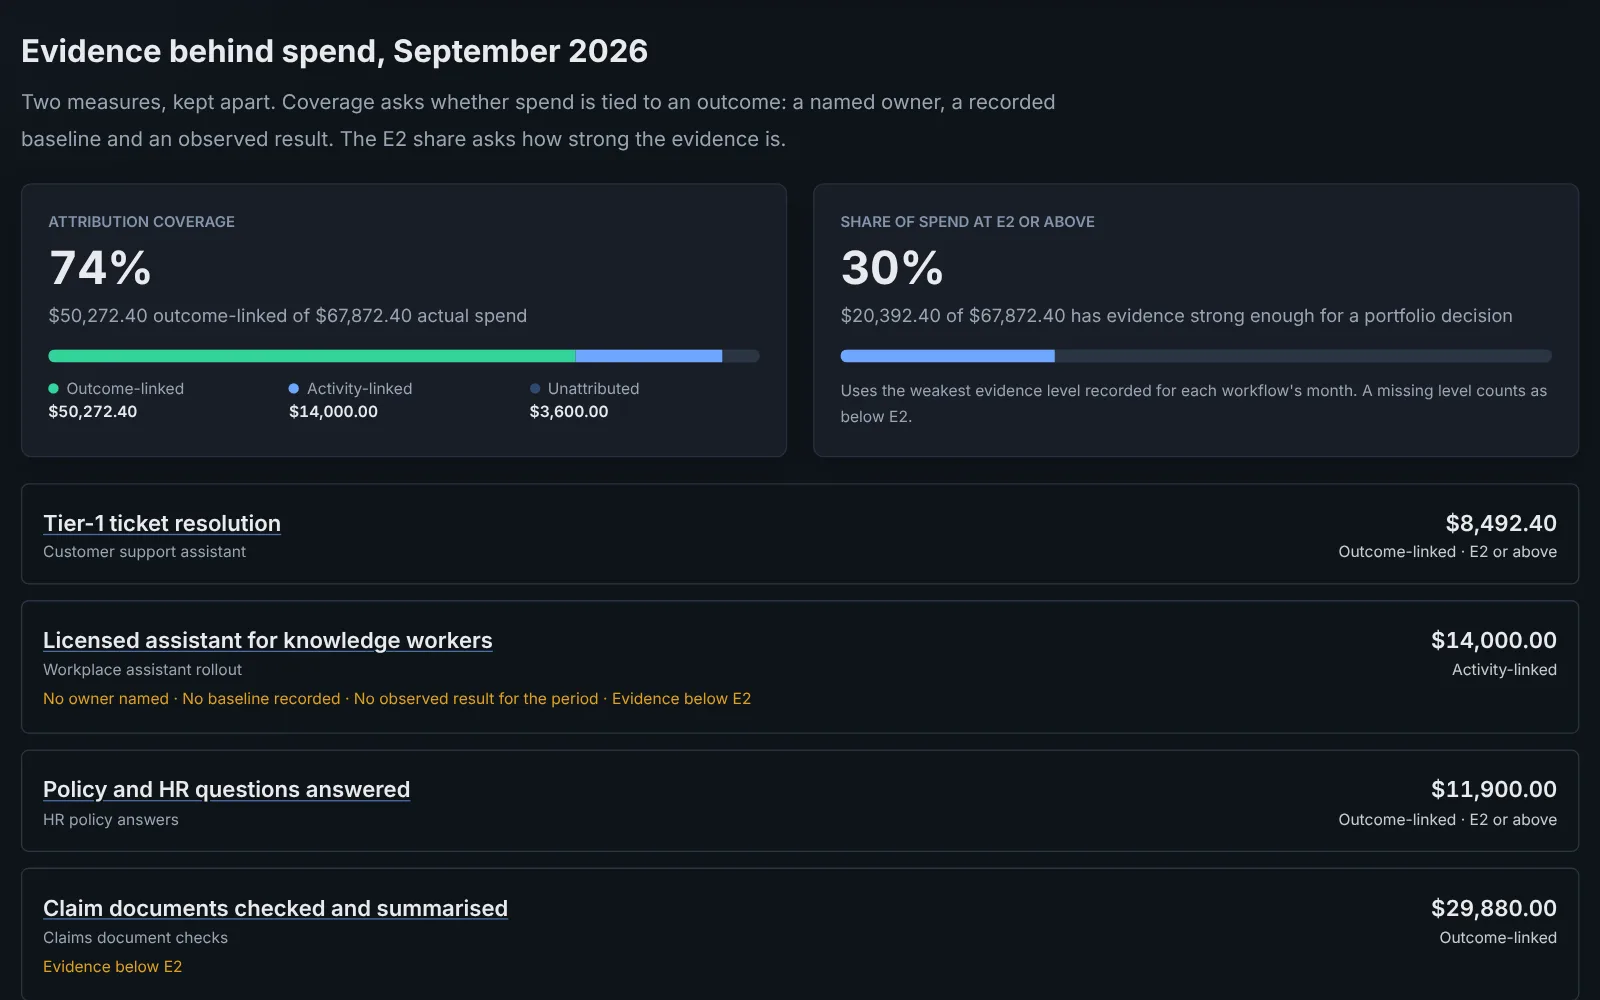
  • The evidence screen: attribution coverage and benefits with raw, claimable and booked amounts kept apart.

    How much of our AI spend can we tie to an outcome?

    Record observations and benefits against a baseline, keep forecast, measured and booked figures apart, and see how much spend is backed by evidence.

    • Attribution coverage
    • Share of spend at E2 or above
    • An evidence trail for each figure

    Read on the Hub: AI value attribution

  • The portfolio dashboard: spend against value for each initiative, with evidence levels and decisions.

    What should the investment or steering group see, and what did it decide?

    Put each initiative's cost, value and evidence for a month side by side, freeze them in a dated snapshot, and draw the investment memo and portfolio summary from it. Decisions are recorded by people, never by the Lab.

    • Portfolio totals that reconcile
    • Dated review snapshots
    • Memo and summary drafts in Markdown

    Read on the Hub: The AI Portfolio Review Pack

Tour

The Lab in two minutes

What each task does and how the Lab keeps its figures honest, narrated over the demo portfolio.

2:18 · Narrated, with captions. Screens show the Lab's demo portfolio: every figure is invented. Download the film (MP4)

Chapters

Read the transcript

What the Lab is. This is the AI Economics Lab: a free working space on AI Economics Hub for the questions that come before and after an AI investment.

Four tasks. You start with the decision in front of you. There are four tasks: estimate a use case, compare options, check the evidence behind spend, and prepare a review.

Estimate a use case. Estimate costs one use case on the path that fits it: a packaged tool, a custom workflow on model APIs, or a choice between paying per token and running dedicated capacity. Every result answers the same questions, starting with the monthly total cost and the cost of each piece of work someone actually accepts.

The estimate dashboard. The dashboard draws the workflow, shows where the money goes, and names the input that moves the answer most. A price you don't know stays blank. It is never counted as zero.

Compare options. Compare puts two options side by side. The Lab only calls one cheaper when both deliver the same thing: the same unit of work, the same workload, and the same costs counted.

Record evidence. In the workspace, you record what actually happened each month. The evidence screen then shows how much of your AI spend is tied to an outcome, and keeps forecast, measured and booked benefits apart, so a projection is never reported as a result.

Prepare a review. Decide brings every initiative together for one month: totals that reconcile, a dated snapshot, and an investment memo drawn from it. The Lab never recommends a decision. People make it, and the Lab records it.

Your data stays with you. Everything stays in your browser. There's no account, and nothing you enter is sent anywhere unless you export it.

Where to start. Open the demo to explore a finished portfolio, or start with your own use case. You'll find the Lab in the site's menu, at aieconomicshub.com/lab.

Results

Every estimate answers the same five questions

Whichever path you cost on, the result has the same shape, so a packaged tool and a custom build can sit side by side. Value figures carry their status: a cost estimate is always a forecast, and only records of what actually happened are measured or booked.

Worked exampleRetrieval template: Claude list prices, invented volumes and baseline.
Monthly TCOConsumption, human effort, fixed operations and amortised build
$13,268.19
Cost per accepted answerMonthly TCO divided by accepted outcomes
$0.78
First-month outlayShown beside TCO, never added to it
$99,518.19
Net resource valueForecastGross benefit less monthly TCO, deducting AI cost once; staff time at loaded cost, not cash
$5,423.86
Resource-value paybackForecastBuild cost divided by gross benefit less monthly run cost; resources at loaded cost, not cash
9.8 months
Cash paybackForecastBuild cost divided by net cash a month, if 40% of the baseline stops being paid
27.6 months
Open this example and change the inputs

Principles

How the Lab keeps its figures honest

  • One unit of work

    Every cost is divided by the same unit, such as a ticket resolved, and two scenarios only compare when they share it.

  • Forecast, measured and booked kept apart

    A scenario is a forecast. It becomes measured or booked only through a separate, linked record, and totals never mix the three.

  • Every figure has a source

    Prices and benchmarks carry a source, a checked date and a label. An unknown price stays blank, never zero.

  • Stays in your browser

    No account and no server copy. Nothing you enter leaves this device unless you export it.