

Key takeaways
- A portfolio review is the point where individual ledgers become decisions. It ends in scale, hold, redesign or stop for each material initiative, with a funded next action and an owner.
- The pack shows realised value next to claimed value. The gap between them is usually the most important number on the page.
- It is a proposal, version 0.5, and a spreadsheet. No specialist platform is needed to start.
The decision this helps make
Which AI initiatives should receive more money, more scarce capacity or less of both, this quarter? Most organisations can list their AI tools. Fewer can put cost, value, evidence and risk side by side, and then act on the result.
A portfolio total can hide this. In a Gartner survey of 160 senior finance leaders, 55% reported positive overall returns from their 2025 AI initiatives, yet 57% of individual use cases had unclear returns, and among those with clear returns negative outcomes slightly outnumbered positive ones (Gartner, reported by CFO.com, 12 October 2026). Gartner describes AI portfolios as relying on asymmetric returns. That only works if someone can see which initiatives are carrying the portfolio and which should stop.
Best for: a finance, technology or AI leader running a first or second portfolio review, with a handful to a few dozen material initiatives.
Not for: valuing a single use case in depth (use the ledger), or replacing a corporate capital planning process. It feeds those processes; it does not stand in for them.
What you need first
- A list of material initiatives, with a named business owner for each.
- Fully loaded annual cost for each: model and consumption, platform, engineering, verification and review, governance, adoption and change, and supplier cost. The AI TCO worksheet covers this.
- A claimed value and a realised value, kept apart. Realised means it has reached an accepted operational or financial record.
- An evidence level, E0 to E4, from the evidence scale.
The inputs to each review
Each initiative is judged on seven things: fully loaded cost, measured net value, evidence level, risk and reversibility, strategic importance, scarce engineering, review and change capacity, and ownership and operational readiness. The spreadsheet holds the first four directly. The rest are judgements the review makes with the numbers in front of it.
The four decisions
The decision rules are those in Scale, hold, redesign, stop. The review applies them as tests:
| Decision | Apply when |
|---|---|
| Scale | High value, low load on the binding constraint, and evidence at or above the level the commitment needs. |
| Hold | Promising, but evidence is below the level the commitment needs, or ownership or controls are not yet in place. Name the evidence and a date. |
| Redesign | The outcome is valuable, but the workflow, model route, contract, verification burden or operating model weakens the case. |
| Stop | No credible route to acceptable value and risk remains within the agreed decision period. Record why. |
The spreadsheet does not choose for you. It flags the arithmetic, such as a claim below E2 that should not yet be monetised, and leaves the decision to the people accountable.
The review agenda
- Movement since the previous review.
- Cost and forecast variance.
- Evidence movement.
- Material value claims.
- Risk and autonomy exceptions.
- Overdue actions.
- Decision requests.
- Capital and capacity reallocation.
Run a short version monthly and a full portfolio review quarterly. The quarterly review also covers attribution coverage, evidence progression and whether the thresholds still fit.
An illustrative portfolio
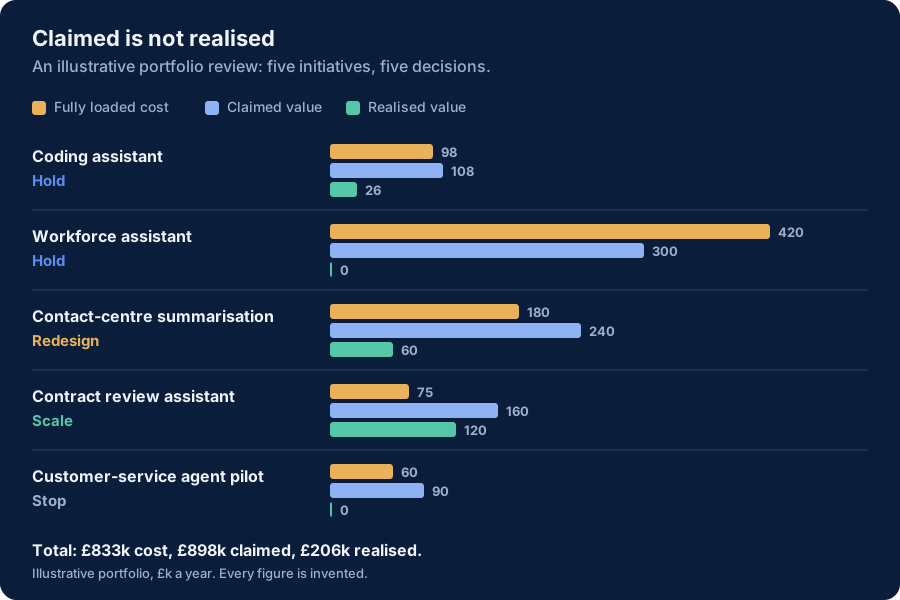
This portfolio is hypothetical. Every figure is invented, and it describes no real organisation. It is the sample data in the downloadable workbook. Money is in £ thousands a year.
| Initiative | Annual cost | Claimed value | Realised value | Evidence | Decision |
|---|---|---|---|---|---|
| Coding assistant | 98 | 108 | 26 | E2 | Hold |
| Workforce assistant | 420 | 300 | 0 | E1 | Hold |
| Contact-centre summarisation | 180 | 240 | 60 | E2 | Redesign |
| Contract review assistant | 75 | 160 | 120 | E3 | Scale |
| Customer-service agent pilot (no named owner) | 60 | 90 | 0 | E0 | Stop |
| Total | 833 | 898 | 206 |
What the summary sheet shows:
- Annualised investment: £833k across five initiatives.
- Claimed against realised: £898k claimed, of which only £508k sits at E2 or above and may be monetised. £206k is realised. The realised net position is −£627k.
- Evidence: £353k of spend, 42%, is at E2 or above. £60k has no named owner or no baseline.
- Decisions: one scale, two hold, one redesign, one stop. The stop is overdue for review.
Four of the five rows have a full decision case. The reasoning, in one line each:
- Coding assistant, Hold. Marginally positive on claim, negative on realised value. Released time has not been shown to convert. This is the worked ledger example.
- Workforce assistant, Hold. The largest cost, with usage but no outcome measure. Fund the evidence before the expansion.
- Contact-centre summarisation, Redesign. A plausible outcome, but the review effort cancels much of the saving. Change the workflow before deciding again.
- Contract review assistant, Scale. Evidence at E3 and most of the claim already realised. Extend it and keep measuring.
- Customer-service agent pilot, Stop. No owner, no baseline, no outcome. End it, release the capacity and record why.
Using the workbook
The Excel workbook has a Portfolio sheet (one row per initiative), a Summary sheet (totals, spend by decision and evidence level, overdue reviews), the agenda, the decision rules and the evidence levels. Input cells are shaded cream and formula cells are locked. Replace the blue illustrative rows with your own.
Portfolio metrics worth reporting each quarter: annualised investment, measured net value, the share of spend at E2 or above, investment by decision, the number and value of overdue decisions, and the capital and capacity released.
Limitations
- The workbook counts spend at E2 or above. It does not reproduce the attribution coverage calculator, which asks how well each category of spend is evidenced. Use both if you need both views.
- Claimed value is the owner's estimate. The pack makes the gap visible; it does not validate the claim. Someone in finance should.
- It does not rank initiatives for scarce capacity. Scale, hold, redesign, stop describes return on scarce capacity as a ranking test.
Status: Proposal, version 0.5. Hub proposals stay below 1.0 until they have survived outside challenge. A proposed operating artefact of this publication, not a standard. Change history: 0.5, 8 October 2026, first release.
Download: AI portfolio review pack, version 0.5, 8 October 2026 (.xlsx). Sample data is invented.