

Key takeaways
- A ledger gives every material AI workflow one record that joins cost, human load, outcome and evidence.
- Its distinctive fields are the evidence level and the decision: scale, hold, redesign or stop.
- It is a proposal, version 0.5, small enough to use. The template file carries its own version number. It is not an accounting standard.
Why a ledger
Most organisations can see what AI costs and how much it is used. Fewer can show what changed because of it. The usual reason is not missing data but missing structure: the cost sits in one system, the usage in another and the business outcome in a third, with nobody owning the join.
A ledger treats value evidence the way finance treats financial evidence. Each material workflow gets a record with a named owner, a baseline, costs, outcomes and a statement of how confident the evidence is. The record is reviewed on a date, and it ends in a decision.
Anatomy
Eight elements describe a workflow. Each answers a question a sceptical reader would ask.
| Element | The question it answers |
|---|---|
| Outcome | What business KPI must change, and to what target? |
| Baseline | Compared with what? The pre-AI or control outcome. |
| Attribution | How much of the change is due to AI, and on what evidence? |
| Adoption | Did the way work happens actually change? |
| Total cost | What did the system consume: model, platform, data, people and change? |
| Human load | Did cost move into people? Minutes and queues. |
| Risk | What downside was created: incidents and expected loss? |
| Persistence | Will the benefit last, or decay? |
The minimum record
Where a team can only keep a few fields, keep these:
- Owner
- Workflow ID
- Model route
- Value hypothesis
- Measurement method
- Evidence level (E0 to E4, see The AI Abundance Paradox)
- Decision: scale, hold, redesign or stop
- Review date
Everything else can be added as the practice matures. A record without an owner or a baseline is a note, not a ledger entry.
Three levels, one trace
Do not force every token into a financial calculation. Measure at three levels and keep a trace between them.
- Transaction. Was this AI action good? Accuracy, completion, latency, retries, cost, override rate. Useful for routing and quality control.
- Workflow. Did the process improve? Cycle time, throughput, human minutes, rework, exception rate. This is the best level for operating economics.
- Business. Did the enterprise outcome move? Revenue, margin, cost, risk, customer and strategic KPIs. This is where realised value is proved.
The trace runs from the AI event to the accepted output, the workflow event, the business KPI and then the financial or strategic value.
How it maps to the Tokenomics Foundation chain
The Tokenomics Foundation's value classification (Release Candidate 2, 16 September 2026, licensed CC BY 4.0) sets out a claim chain in four steps. Observe gathers inputs in the unit of the baseline. Net turns them into one number with one confidence mark. Convert carries the net number into another unit if the audience needs one. Book names where a dollar result lands in the ledger. The Foundation is explicit that its output is a value claim, not a return, and that a claim can stop at Net.
A ledger line can be read against that chain:
| Ledger field | Where it sits in the Foundation chain |
|---|---|
| Workflow, owner | Scope of the claim (Observe) |
| Baseline | Baseline (Observe) |
| Current outcome | Observed state (Observe) |
| Review and rework cost | Cost created (Observe) |
| Evidence provenance: measured, sampled or estimated | Provenance mark on each input |
| Attribution and net outcome | Net |
| Monetisation | Convert |
| Budget line | Book |
| Evidence level (E0 to E4) | Not in the Foundation method. Added here |
| Decision and review date | Not in the Foundation method. Added here |
The Foundation separates what nets inside a claim from the total cost of AI, which it describes as work in progress. The ledger's total cost field sits on that side of the line.
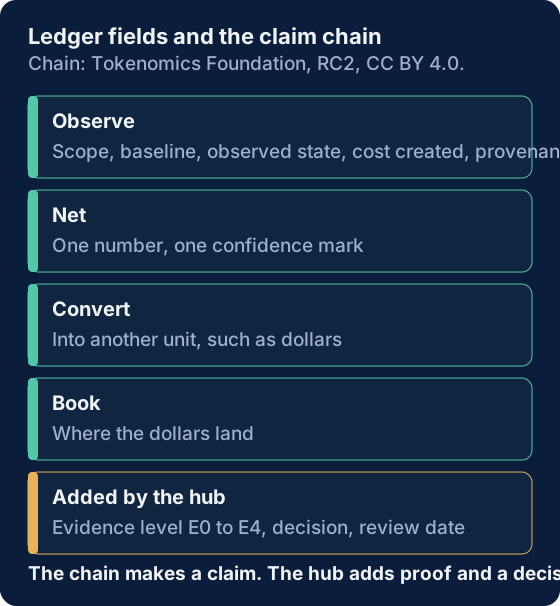
What the ledger adds
The Foundation's method is about producing a defensible value claim. The ledger is about what an organisation does with one. It adds two things at the point where a claim meets a decision:
- An evidence level, so the number is labelled with how strongly it is known.
- A decision and a review date, so the record ends in scale, hold, redesign or stop rather than in a report. Hold means keeping a workflow at its current size while named evidence is gathered by a set date.
An illustrative entry
This example is hypothetical and exists only to show the shape of a record.
| Field | Illustrative entry |
|---|---|
| Owner | Head of Customer Operations |
| Workflow | First-line support drafting |
| Value hypothesis | Drafting assistance reduces handling time without lowering resolution quality |
| Baseline | Handling time and resolution rate for the quarter before rollout |
| Evidence level | E2: matched cohort |
| Human load | Review minutes per item, tracked weekly |
| Decision | Scale to two further teams if the resolution rate holds |
| Review date | End of next quarter |
A worked example
The entry above shows the shape. This one shows the arithmetic, and why the decision follows from it. Every figure is invented. It is Illustrative and describes no real organisation.
Workflow. An AI coding assistant for 120 engineers. Owner: Director of Engineering. Value hypothesis: the assistant releases engineering time without lowering code quality.
Step 1: full monthly cost. Count everything the workflow consumes, not only the licence.
| Cost line | Monthly (£) |
|---|---|
| Licences (120 seats at £24) | 2,880 |
| Model and API consumption | 1,100 |
| Platform and integration | 600 |
| Enablement and change (amortised) | 800 |
| Extra code review and verification | 2,400 |
| Governance and assurance | 400 |
| Fully loaded cost | 8,180 |
Step 2: what changed. A matched-cohort comparison (same repositories, same period) shows 410 engineering hours a month released against the baseline. That is E2 evidence: enough to monetise a claim, not enough for a material investment.
Step 3: claimable value. Apply attribution and persistence to the released time.
| Line | Calculation | Monthly (£) |
|---|---|---|
| Released time at £55 an hour | 410 hours × £55 | 22,550 |
| After attribution (0.5) | 22,550 × 0.5 | 11,275 |
| After persistence (0.8) | 11,275 × 0.8 | 9,020 |
| Claimable value less fully loaded cost | 9,020 − 8,180 | +840 |
Step 4: what has been realised. Released time is not the same as booked value. Only 100 of the 410 hours have been absorbed into something the finance record shows, such as reduced contractor hours. On the same attribution and persistence: 100 × £55 × 0.5 × 0.8 = £2,200. Against the same cost, the realised position is £2,200 − £8,180 = −£5,980.
Step 5: decision.
| Field | Entry |
|---|---|
| Evidence level | E2: matched cohort |
| Claimed net position | +£840 a month |
| Realised net position | −£5,980 a month |
| Decision | Hold |
| Why | The claim is positive but rests on time that has not yet been converted. Scaling would add cost faster than booked value |
| Named evidence and date | Evidence of absorbed capacity (contractor spend or throughput) for at least 250 hours a month, within two quarters |
| Owner | Director of Engineering |
| Review trigger | Absorbed hours reported at the quarterly portfolio review |
A board line for the same entry: The coding assistant is recommended for Hold because it is marginally positive on claimed value (+£840 a month, E2) but negative on realised value (−£5,980 a month). The main uncertainty is whether released time converts to booked value. The next action is to track absorbed capacity, owned by the Director of Engineering, reviewed at the next quarterly portfolio review.
The same workflow could be Scale if absorption were shown, or Redesign if review cost were the constraint. The record does not decide that. It makes the choice visible and dated.
What to do next
Start with the two or three workflows that carry the most spend. Give each an owner and a baseline before anything else. Then add the evidence level. The attribution coverage calculator shows what share of spend already has this kind of backing.
Status: Proposal. Framework version 0.5 (see the frameworks page); template version 1.1. Hub proposals stay below 1.0 until they have survived outside challenge. The ledger is a proposed operating artefact of this publication, not a standard. A downloadable template is available on this page.
Download: AI value ledger template, version 1.1, 8 October 2026 (.xlsx). It has a ledger sheet with an illustrative example row (invented figures), the evidence levels, the decisions, instructions and a version sheet. Input cells are shaded cream and formula cells are locked. Version 1.1 clarifies the total cost and net outcome columns and adds a column comparing claimable value with total cost. Version 1.0 (6 October 2026) remains available. Change history: 1.1, 8 October 2026; 1.0, 6 October 2026, first release.