

Key takeaways
- Cheap generation does not remove scarcity. It moves it to whatever cannot scale at the same rate: usually review, decisions and change.
- AI value is capped by what people can verify and absorb, so the economics have to price that capacity, not only tokens.
- A simple load reading, the AI Pressure Index, shows when review and absorption are filling up before the queue is visible.
- Autonomy and value claims should be earned with evidence. The proof required should rise with the money and risk involved.
- This is a proposal for an emerging discipline, version 0.5. It is a set of management heuristics, not a standard.
The old rule
For most of the history of knowledge work, creating something was expensive. A report, a piece of software, a campaign or an analysis took people and time. That cost did a quiet job: it forced prioritisation before production. A new idea had to survive a business case, a budget round, a backlog or a stage gate before anyone built it.
Scarcity acted as an implicit governance system. Most organisations never wrote that down, because they did not need to.
What changed
AI removes much of that friction. Drafts, code, analysis, options and agent actions can now be produced at very low marginal cost. The old filter on weak ideas has not been replaced by anything. It has simply stopped working.
The constraint has not gone. It has moved. This is the paradox: as generation gets cheaper and faster, the total amount of work an organisation can usefully absorb does not rise at the same rate. More output arrives at the same few decision points.
One moving constraint
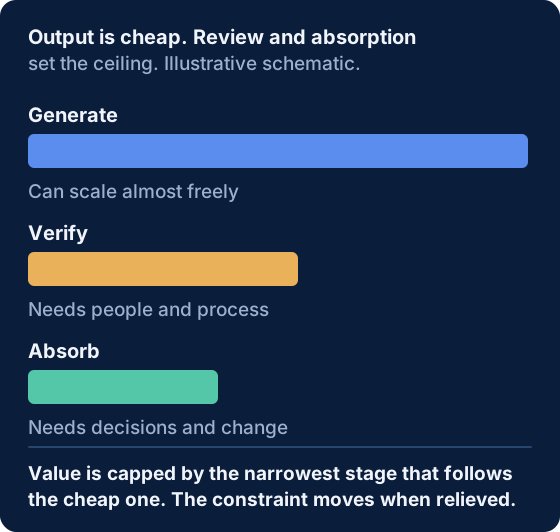
A workflow with AI in it has three stages that matter for economics:
- Generate. Produce drafts, code, analysis, options and agent actions.
- Verify. Establish that the output is right, safe and compliant, to the level the risk demands.
- Absorb. Decide, adopt, change the process and bank the benefit.
A named human owner stays accountable for the outcome, whoever or whatever did the work.
Read this as a flow. One stage is the binding constraint at a time, and the constraint moves when it is relieved. Speed up generation and the queue appears at verification. Speed up verification and it appears in decisions, then in change. A local ten-times speed-up in one task can simply create a ten-times queue somewhere else.
Real enterprises have more than three limits. Throughput is capped by the weakest of generation, verification, integration, decision, absorption and physical or permission limits. Where the bottleneck sits varies by workflow. In knowledge work it usually lands on human attention first, so that is the focus here.
Measuring it: the AI Pressure Index
A diagnostic is useful only if it is simple enough to use. The AI Pressure Index asks whether downstream human capacity is being consumed faster than it recovers.
For each downstream stage:
Load = capacity required, divided by protected capacity available, in the unit that fits the stage. For review, that is hours of human judgement arriving each week divided by protected reviewer hours each week.
Pressure = the highest of the verify, decision and change loads.
Count only what still needs a person after automated checks, and count governance work too. Read it per workflow and per risk tier.
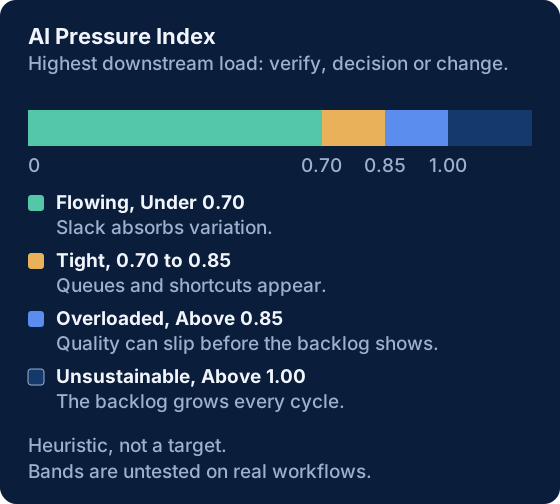
| Pressure | Band | What it means |
|---|---|---|
| Under 0.70 | Flowing | Slack absorbs variation. |
| 0.70 to 0.85 | Tight | Queues and shortcuts start to appear. |
| Above 0.85 | Overloaded | Quality can degrade before the backlog looks serious. |
| Above 1.00 | Unsustainable | The backlog grows every cycle. |
The bands sit below 1.0 on purpose. Work does not arrive evenly, so near full load every surge becomes a queue that does not clear. People also rarely let a queue show: they review faster, and quality slips silently. The practical rule is to act at tight, not at unsustainable.
Attention is not one thing
Review, decision and change capacity deplete in different ways and do not substitute for each other.
- Review checks the work is right. It runs out through volume and monotony, as vigilance fades. Budget it as protected reviewer hours.
- Decision chooses what to do with the work. It runs out through too many options and too many open items. Budget it as forum slots and a limit on open decisions.
- Change absorbs the work into how people operate. It runs out when too many changes land on the same teams. Budget it as release slots, training and implementation capacity.
Each can be capped and funded like output. The sender should pay for the attention used: no evidence pack, no place in the queue.
Review is a control, not a cost to remove
A common response to a review queue is to chase a higher automation rate. That measures the share of work completed without people, and it aims to remove review. The risk is that quality slips with nobody placed to notice.
The alternative is to treat human review as a control and measure whether it works: review load, and the detection rate on seeded errors. Signs that review is being faked include review minutes per item falling, approval rates drifting towards 100 per cent, escaped defects rising and seeded errors being missed. A human in the loop is a control only if its detection rate is tested.
Risk then decides how much attention each item earns:
- Glance. Low stakes, reversible, small blast radius. Automated checks plus a random human sample. A person approves the policy, not each item.
- Check. Material but recoverable. A person checks the evidence pack and samples the work. Each item is approved in minutes.
- Scrutinise. High stakes or hard to reverse: money, legal, safety, people. A named, independent reviewer with authority to reject, and a recorded decision.
Tiers should be set against published criteria and enforced in the workflow, not chosen by the sender.
Value has to be proved, not assumed
Cheap output makes activity easy to count and value hard to show. The chain runs from AI activity to output, decision, action, outcome and value. Measurement confidence tends to fall as economic relevance rises: system telemetry is reliable, workflow evidence is moderate, and causal attribution is hard.
A usable value equation penalises weak evidence, short-lived benefit, hidden cost and expected loss:
Net AI value = (incremental outcome × monetisation × attribution × persistence × confidence) − total cost − expected loss − opportunity cost
Here the incremental outcome is the outcome with AI minus the estimated outcome without it. This is a management equation, not an accounting standard. Keep confidence and non-financial value explicit rather than hiding them in a precise ROI figure.
Evidence levels: compared with what?
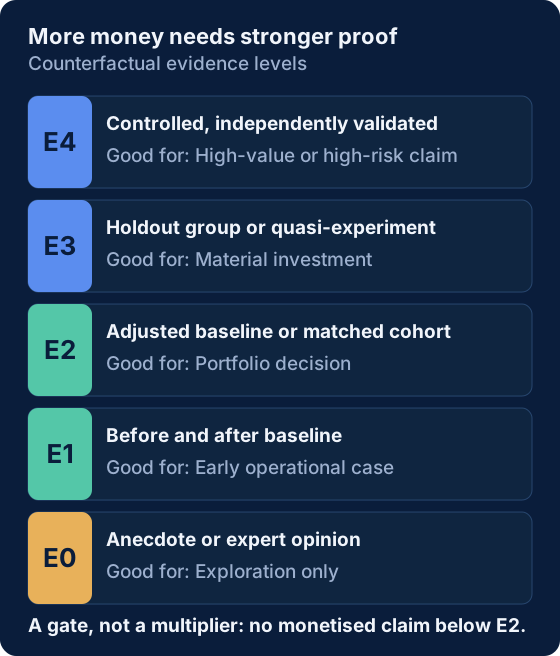
An improvement after AI arrives is not proof that AI caused it. The proof needed should rise with the scale, risk and irreversibility of the decision.
| Level | Evidence | Good enough for |
|---|---|---|
| E0 | Anecdote or expert opinion | Exploration only |
| E1 | Before and after baseline | An early operational case |
| E2 | Adjusted baseline or matched cohort | A portfolio decision |
| E3 | Holdout group or quasi-experiment | A material investment |
| E4 | Controlled experiment, independently validated | A high-value or high-risk claim |
The level is a gate, not a multiplier: no monetised claim below E2. Reversible work under a materiality threshold can take a fast lane at E0 or E1, with a capped budget, a named owner and a review date.
Label every number too. Some are measured (tokens, cost, queue age). Some are proxies (reviewer attention, adoption), useful but gameable. Some are judged (the counterfactual, attribution, persistence) and need a holdout or a finance judgement. Hours saved are capacity released, not cost saved, until cash leaves the cost base, more output is counted or redeployment is measured. A value claim that mixes all three should not be shown as one figure.
Pricing the scarce thing: return on scarce capacity
If cheap creation floods the portfolio with good ideas, rank them by what they use of the binding constraint:
Return on scarce capacity = expected net value ÷ load on the bottleneck
Take two projects each worth £1m. One needs 400 legal review hours and the other needs 40. They have the same return on cost and a tenfold difference in return on scarce capacity. The figures are illustrative.
| Value | Low load | High load |
|---|---|---|
| High value | Scale | Redesign: relieve the constraint first |
| Low value | Opportunistic: light guardrails | Stop |
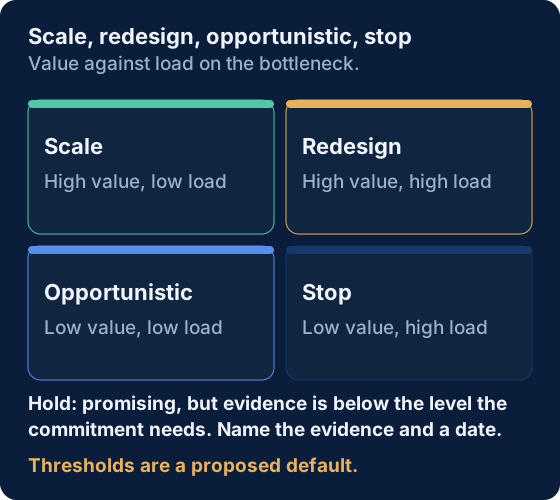
Use it to rank, not to state a value. It already prices opportunity cost, and it should be re-run when the constraint moves.
Model routing is a lever
Because token cost is only one part of the system, model choice is a routing decision rather than a procurement event. Use the lowest-cost path that reliably meets the outcome, risk and latency requirement: rules or retrieval where they are enough, then small or open models, efficient hosted models, and frontier models only where complexity or value justifies the premium. Humans take the exceptions that need judgement. Benchmark on your own workflow, re-test often, keep portability and count retries, because a cheap model that raises correction work is not cheap.
What to do on Monday
- Pick two or three workflows where AI output is already arriving, and record queue age, lead time, rework, escaped errors and the business KPI.
- Name owners and tier the work as Glance, Check or Scrutinise, with protected reviewer capacity.
- Set back-pressure. No evidence pack, no queue. Let unreviewed work expire rather than become permanent backlog.
- Read the pressure and the value. Estimate the Pressure Index and the evidence level behind each value claim. Scale, redesign or stop.
A CFO or CIO question to carry into the next review: which scarce capacity is this initiative using, and what is the evidence that it is worth that capacity?
If a workflow has no new bottleneck and no need to evidence value, this framework adds little. That is a useful test of it.
Status and provenance
Framework status: Proposal, version 0.5. The constructs on this page are management heuristics proposed by this publication, not industry standards. The building blocks are not new: Simon on attention (1971), Goldratt on constraints (1984), Jevons on rebound effects (1865) and Bainbridge on the limits of human oversight of automation (1983). What this page proposes is their combination into a way of pricing review and absorption capacity.
Convergent research. Others have since reached the same constraint from different directions. Catalini, Hui and Wu model AI as rapidly cutting the cost of execution while the cost of verification, bounded by human time and attention, falls far more slowly, so that verification becomes the scarce input (Some Simple Economics of AGI, February 2026). Research from Stanford's Social Media Lab and BetterUp Labs on "workslop", AI-generated work that looks finished but is not, found that about 40% of 1,150 US desk workers had received it in the past month, at close to two hours of rework per instance (Harvard Business Review, September 2025, reported via Axios). What this page adds is a way to price the constraint in a business case and a decision rule, through the AI Pressure Index and return on scarce capacity.
Measurement standards for AI cost and usage are being developed elsewhere, including by the Tokenomics Foundation and in the FOCUS specification. This page addresses a different question: what the output uses up, and whether the value is real.