

AI economics is the management discipline concerned with how the resources used to produce and consume AI become business outcomes, and how evidence about those outcomes informs allocation decisions.
That definition is deliberately narrow. It leaves out model research, AI policy and the macroeconomics of automation. What it keeps is the chain a finance or technology leader actually has to manage: money and capacity go in, work comes out, something changes in the business, and someone decides whether to put in more.
The chain has four jobs:
- Produce intelligence. Make model capability available at a known cost.
- Consume it in work. Put that capability into tasks, workflows and agents.
- Measure the result. Establish what changed because AI was used, and how sure you are.
- Allocate. Decide where the next pound, engineer-hour and review slot should go.
External standards and established disciplines increasingly cover the first three. The fourth is where leadership judgement begins, and it is where this site concentrates.
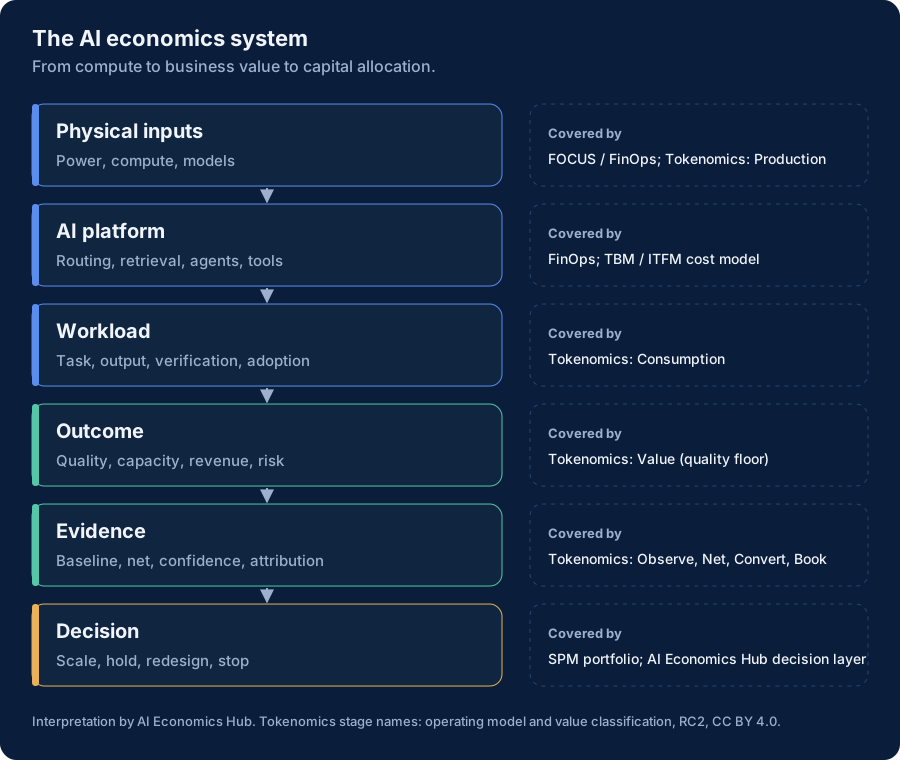
Production: what does useful intelligence cost to make available?
Production covers power, data-centre capacity, accelerators, cloud contracts, the models themselves, and the platform around them: gateways, retrieval, orchestration and the engineers who keep it running.
Two features make this layer different from most technology cost. Supply can be physically scarce, so capacity sometimes has to be secured before anyone consumes it. And the unit price of a given level of capability has been falling while the capability on offer keeps moving, so last year's price list is a poor guide to next year's bill.
The Tokenomics Foundation calls this stage Production in its personas and operating model (Release Candidate 2, 4 September 2026), and gives it its own persona, Capacity, responsible for securing physical supply. The FinOps Foundation's FOCUS specification provides the common format for the cost and usage data. TBM and ITFM practice place the platform inside the wider technology cost model.
Question for this layer: what does a unit of useful capability cost us, fully loaded, and how exposed are we to capacity or price changes? The AI TCO framework and rent, reserve or own cover the detail.
Consumption: where is intelligence being used, and at what unit cost?
Consumption is where cost becomes attributable. A call is made by a user, a workload or an agent; it goes through a route to a model; it carries context, hits or misses a cache, triggers tool calls and sometimes retries.
This is the layer where most current tooling is strongest. Gateways and provider billing can show tokens, calls and cost by key, model and, with some effort, by team. The hard part is attaching each call to a workload with an owner, because without that join nothing downstream can be measured. What you actually need to measure AI value sets out the data that join requires.
The Tokenomics Foundation calls this stage Consumption, with Engineering, FinOps and the AI end user as the main roles.
Question for this layer: which workloads consume what, at what cost per call, per task and per successful outcome?
Value: what changed because the workload used AI?
Value starts with a baseline, a quality threshold and an outcome. It then nets out the costs that consumption data never shows: review, rework, escalation, and the harm from errors that got through.
The Tokenomics Foundation's value classification (Release Candidate 2, 16 September 2026) sets out a chain for this: Observe the inputs in one unit, Net them into one number with one confidence, Convert that number into another unit where needed, and Book it where the value lands. It also defines a quality floor: the minimum quality an output must reach before it counts at all.
Question for this layer: what is the value claim, net of rework and harm, and how confident are we in it? How to measure AI value works through three examples.
Decision: what should we do next?
A booked value claim is not a decision. Two workloads can carry similar claims and still deserve opposite treatment, because the claim leaves out five things a leadership team has to weigh:
| Input | Why it changes the decision |
|---|---|
| Economic result | The net value claim against fully loaded cost, including verification. |
| Evidence strength | A before-and-after anecdote and a controlled comparison should not attract the same capital. See evidence levels. |
| Scarce capacity consumed | Review hours, change slots and engineering time are finite. A workload that uses a lot of them crowds out others. |
| Risk and reversibility | Errors that cannot be undone need more proof before more autonomy. See proof for autonomy. |
| Strategic importance | Some work is worth continuing at a short-term loss, as long as that is a recorded choice. |
The output of the decision layer is not another KPI. It is an action. The site's proposal is four primary decisions, scale, hold, redesign or stop, with a set of common redesign moves underneath "redesign": route to a cheaper model, add or remove a human check, move inference to reserved capacity or on-device, renegotiate the supplier, or change the workflow rather than the model.
Question for this layer: given the claim, the evidence, the capacity it uses and the risk, which of the four decisions applies, and who owns the next step?
A worked example: one workload through the whole chain
The figures below are illustrative, chosen to show the mechanics. They are not survey data.
A claims-handling team uses an AI assistant to draft first responses to routine insurance queries.
| Layer | What the team finds |
|---|---|
| Production | A mid-tier model through a cloud provider, with a shared retrieval platform. Platform share and engineering: £9,000 a month. |
| Consumption | 60,000 drafts a month. Model and retrieval cost: £4,800 a month, about 8p a draft. |
| Value: observe | Handling time per routine query fell from 11 to 7 minutes against a three-month baseline. |
| Value: net | 9% of drafts need substantial rework, and complaint rates are unchanged. Net saving about 3.3 minutes a query, roughly 3,300 hours a month. |
| Value: convert and book | The team absorbs growing volume without two planned hires. Booked as avoided cost of about £7,500 a month, not as the full hours multiplied by salary. |
| Decision | Value of £7,500 against cost of £13,800: negative on direct economics. Evidence is a before-and-after baseline, E1. Review load is low. |
On these numbers the workload does not pay for itself, mainly because of the shared platform charge, which would exist whether or not this workload ran. The decision is redesign, not stop: test a cheaper model against the same quality floor, and check whether the platform charge is being allocated fairly. If the cheaper route clears the floor at half the model cost and the platform share falls as other workloads join, the case turns positive. The next review is in one quarter, with a holdout group to lift the evidence to E2.
Without the full chain, this team would have reported 3,300 hours saved and asked to scale.
How this differs from what already exists
None of the first three layers is original to this site, and the map is not a competing standard. FOCUS and the FinOps Framework cover cost and usage data. The Tokenomics Foundation covers the production, consumption and value stages and the value claim. TBM, ITFM and SPM cover cost models, budgeting and portfolio governance.
What this site adds is the connection between them and the decision rules at the end: attribution coverage as a portfolio measure, the AI value ledger as the record that carries a claim into a decision, evidence levels, return on scarce capacity, and scale, hold, redesign or stop. Each is labelled as a proposal on the frameworks page.
An earlier page on this site, the AI economics stack, described production, application and enterprise value in three levels. This map replaces it, and its old address now redirects here, because the Tokenomics Foundation's stages now cover that ground.
What would change this view
- If value measurement becomes routine and cheap, the decision layer matters less, because good evidence would make most decisions obvious. There is little sign of that yet.
- If most AI spend stays embedded in SaaS contracts, the consumption layer may never be observable at workload level, and the map needs a different route from cost to value for that spend.
- If the external standards extend into allocation, this site's decision rules should defer to them where they overlap.