

AI value measurement usually fails in the same place. A team reports that a tool saved time, someone multiplies the hours by a salary, and the result is presented as a return. That skips most of the work.
A defensible claim starts with a workload, a baseline and a quality threshold. It nets out the review and rework the AI created. It says what happened to the time released. Only then does it convert the change into money, and only then can anyone compare it with the full cost and decide what to do.
Start with the external method
The Tokenomics Foundation's Classifying and Measuring Realized Value from AI (Release Candidate 2, 16 September 2026, CC BY 4.0) is the most complete public method for the first half of this job. In brief:
- It starts from the business mission: what a good outcome looks like at each level of the organisation.
- It separates Product AI, judged on growth, margin and customer outcomes, from Internal AI, judged on cost reduction, efficiency and new capability. The two need different financial treatment.
- It names outcome categories such as revenue enablement, cost avoidance, capacity gain, risk reduction and new capability.
- It builds a claim in four steps: Observe, Net, Convert, Book. Observe gathers the baseline, the observed state, the quality floor, the cost created and how each input was known. Net turns them into one number with one confidence. Convert carries that number into another unit if needed. Book places a money result in the profit and loss account or balance sheet.
- It is explicit that the output is a value claim, not a return. Return also needs the total cost of AI.
- It describes a progression: stop at Net in native units, then run through to Book, then compose the claim against total cost for a return.
This site uses that method rather than inventing a parallel one. What follows adds the steps that turn a claim into a decision.
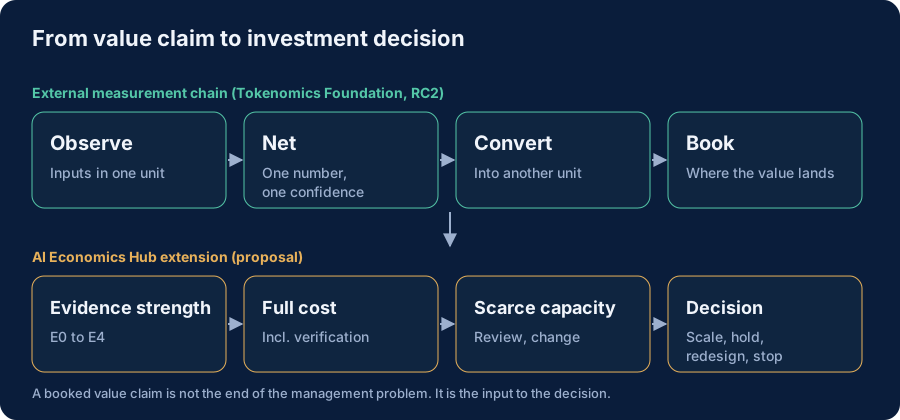
Four steps after the claim
A booked claim answers "what changed, and what is it worth". A leadership team still needs four more answers.
1. How strong is the evidence? A before-and-after comparison with no control is weaker than a holdout group, which is weaker than a randomised comparison. This site grades evidence from E0 (anecdote) to E4 (controlled and independently validated), and proposes that the size of the commitment should set the minimum level. See the AI Abundance Paradox for the scale.
2. What is the full cost? The claim nets the cost the AI created inside the workflow, such as rework. It does not include the share of platform, engineering, governance and verification that the workload depends on. The Foundation describes total cost of AI as work in progress; the AI TCO framework is this site's version. Cost and value must share the same workload boundary, a point the Foundation makes explicitly, or the comparison is meaningless.
3. What scarce capacity does it use? Review hours, change slots and specialist time are finite. A workload with a good claim that consumes most of a team's review capacity may still be the wrong one to scale.
4. What is the decision? Scale, hold, redesign or stop, with an owner and a review date. See the decision rules.
Worked example 1: a coding assistant
Illustrative figures for a 120-developer engineering organisation. Not survey data.
| Step | Finding |
|---|---|
| Baseline | Median cycle time from first commit to merge: 3.1 days, over the previous two quarters. |
| Quality floor | A change counts only if it merges and is not reverted within 30 days. |
| Observe | After six months: median cycle time 2.6 days. Reverts up from 2.0% to 2.6% of merged changes. Review time per change up about 10%. |
| Net | Cycle time improved about 16%, partly offset by more review and more reverts. Confidence: moderate, because a platform migration ran during the same period. |
| Convert | The organisation does not plan to reduce headcount. The honest conversion is capacity: more changes shipped per quarter, not salary saved. |
| Book | Not booked as a cost saving. Reported as capacity gain against the delivery roadmap. |
| Evidence | E1: before and after, with a confounding change. |
| Full cost | Licences £3,600 a month plus a share of security review and enablement, about £5,500 a month in all. |
| Decision | Hold. Keep the tool, but run a holdout on two teams for one quarter before buying more seats or a more expensive tier. |
The tempting version of this claim was "16% faster, times 120 developers, times salary". On these facts it would have overstated a capacity gain as a cash saving, and ignored the rise in reverts. The engineering evidence is mixed enough that the holdout matters.
Worked example 2: a customer-service agent
Illustrative figures for a retail contact centre handling 200,000 contacts a month.
| Step | Finding |
|---|---|
| Baseline | Cost per resolved contact £4.20; repeat-contact rate 14%. |
| Quality floor | A contact counts as resolved only if there is no repeat contact on the same issue within seven days. |
| Observe | The agent fully handles 38% of contacts. Of those, 11% generate a repeat contact, against 14% before. |
| Net | About 67,600 contacts a month resolved by the agent and clearing the floor. Escalations and repeat contacts are counted against it. |
| Convert | Avoided handling cost at the human cost per contact, less the agent's per-contact cost of £0.55. |
| Book | Cost avoidance in the contact-centre budget, because the centre has stopped backfilling leavers. |
| Evidence | E2: the agent was rolled out region by region, so later regions act as a matched comparison. |
| Full cost | Agent platform, integration, quality monitoring and one analyst: about £52,000 a month. |
| Decision | Net saving of roughly £3.65 per contact on 67,600 contacts is about £247,000 a month against £52,000 of cost. Scale, with a monthly check on repeat-contact rates and complaints. |
The quality floor is what makes this claim credible. Counting every contact the agent touched, instead of the ones that stayed resolved, would have overstated the volume by more than 8,000 contacts a month.
Worked example 3: a financial research assistant
Illustrative figures for an equity research team of 15 analysts.
| Step | Finding |
|---|---|
| Baseline | Analysts spend about 30% of their time gathering and summarising filings. |
| Quality floor | A summary counts only if an analyst signs it off without material correction. |
| Observe | 62% of summaries clear the floor. Analysts report time saved, but nobody measured it. |
| Net | Cannot be stated with confidence. Self-reported time is not a measurement. |
| Convert | Not attempted. |
| Book | Not attempted. |
| Evidence | E0: opinion. |
| Full cost | About £6,000 a month, mostly model cost on long documents. |
| Decision | Hold, and measure. Time-box a four-week sample in which analysts log gathering time with and without the tool, and set a floor-clearance target before deciding on renewal. |
This is the most common real situation: a tool everyone likes and nobody has measured. The right response is not to estimate a return. It is to collect the two numbers the claim needs.
Common errors
- Multiplying hours by salary. Released time becomes money only if it is redeployed to something valued, or the cost is actually removed. Say which.
- Counting outputs that do not clear the floor. Rejected drafts, reverted code and repeat contacts are cost, not value.
- Mismatched boundaries. Comparing a whole department's AI bill with one workflow's savings, or the reverse.
- Treating a claim as a return. A claim without full cost is not an ROI, however confident it is.
- Precision without evidence. A claim to the nearest pound with E0 evidence should be reported as a range, or not at all.
What would change this view
- If the Tokenomics Foundation's method reaches a stable release that covers total cost of AI and evidence strength, the extension proposed here should shrink to whatever it still adds.
- If organisations find that the full chain costs more to run than the decisions it improves are worth, a lighter method for small workloads is needed. That question is open.