

Most guidance on AI value says which metrics matter. Less of it says where the data comes from, and that is usually where programmes stall. A finance team can be told to measure cost per successful outcome and still have no way to connect a model invoice to a resolved case.
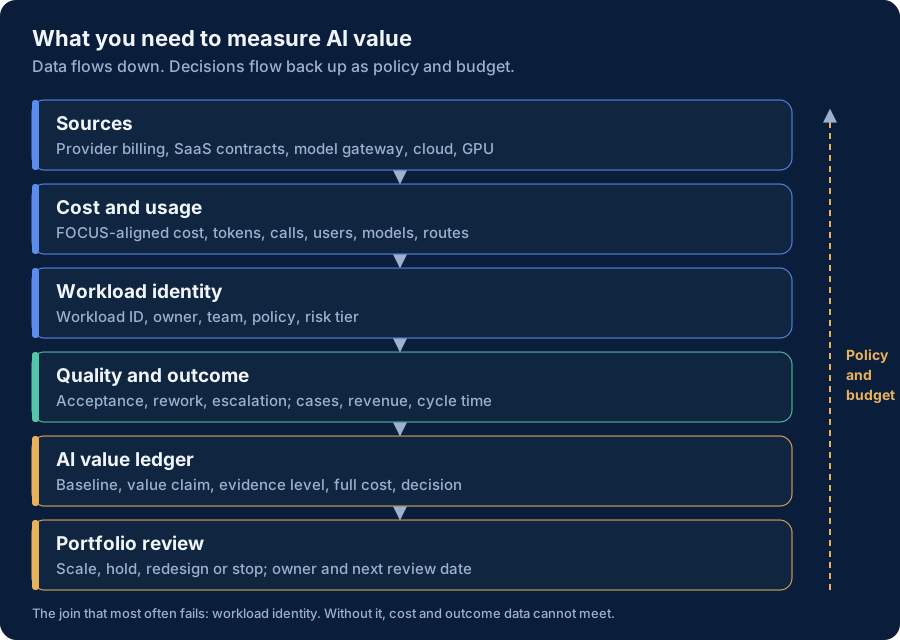
This blueprint sets out the five kinds of data AI value measurement needs, the usual source of each, and the join that holds them together.
1. Cost
| Data | Usual source |
|---|---|
| Model and API spend | Provider billing and usage APIs; see the billing APIs reference |
| Cloud-hosted model and GPU cost | Cloud billing, ideally in the FinOps Foundation's FOCUS format |
| Gateway and platform cost | Gateway logs, platform team's cost model |
| Seat-based AI tools | Contracts and licence management |
| AI inside SaaS products | Contracts and renewals; often not separable from the base product |
| Platform labour | Time tracking or allocation from the platform team |
| Verification labour | Sampling: how long people spend checking and fixing AI output |
The last two rows are rarely captured and often large. Estimate them by sampling if there is no better source, and mark them as estimates.
2. Usage
User, team, workload, feature, model, session, agent run, tool call, tokens in and out, latency, cache hits and route taken. A model gateway is the most practical single point to capture most of this, because every call passes through it. Without a gateway, usage data is spread across provider consoles and is hard to join.
3. Quality
Acceptance and rejection, re-prompts, manual corrections, escalations to a person, evaluation scores, errors and policy violations. This is the data that tells you whether outputs clear the quality floor. Some of it comes from the application, such as an "accept" button or a merge event. Some needs deliberate sampling, such as a monthly review of fifty outputs.
4. Outcome
The business event the workload is meant to change: a transaction, a resolved case, revenue, cycle time, defects, churn, a risk event. This data already exists in business systems: CRM, ticketing, ERP, version control. The task is not to collect it but to connect it to the AI activity that preceded it.
5. Portfolio metadata
Owner, baseline, evidence level, risk tier, budget, strategic priority and the last decision. This lives in the AI value ledger or whatever portfolio tool the organisation already uses.
The join that breaks: workload identity
Cost data knows about API keys, accounts and models. Outcome data knows about cases, orders and deployments. Neither knows about the other. The only thing that can connect them is a workload identifier carried by both: a tag on each AI call that says which workload it belongs to, and the same identifier on the business record the workload touches.
The Tokenomics Foundation's value classification makes the same point from the other direction: cost and value must share the same workload boundary, or the comparison does not hold.
In practice:
- Define workloads at the level decisions are made: "claims first-response drafting", not "the AI platform".
- Issue workload IDs from a register owned by the platform team, with a named business owner for each.
- Require the ID on every call through the gateway. Untagged calls go to an "unattributed" bucket that is reported, so the gap stays visible.
- Write the ID onto the business record where possible: the ticket, the pull request, the case.
- Report attribution coverage: the share of spend that carries a workload ID with an owner, a baseline and an outcome measure. See the AI Value Gap.
Grain
Cost and value need to be compared at the same grain. Common choices, from coarse to fine:
| Grain | Good for | Watch out for |
|---|---|---|
| Department per month | Budgeting, first attribution | Hides which workloads drive cost |
| Workload per month | Most value decisions | Needs workload IDs |
| Feature or session | Product AI unit economics | Volume of data |
| Task or case | Quality floor, cost per successful outcome | Joining to outcomes is hardest here |
Start at workload per month. Go finer only where a decision needs it.
A minimum viable setup
For an organisation starting now, a reasonable first quarter:
- route new AI workloads through a gateway that records workload IDs;
- export provider and cloud cost in a consistent format, ideally FOCUS;
- register the ten largest workloads with an owner and a baseline;
- sample quality monthly for those ten;
- connect each to one outcome measure in an existing business system;
- review them monthly in one place.
That is enough to compute attribution coverage honestly and make the first round of scale, hold, redesign or stop decisions.
What would change this view
- If AI spend embedded in SaaS products becomes the majority, much of it may never carry a workload ID, and estimation by contract will have to stand in for measurement.
- If providers and gateways converge on a standard workload tag, step 3 becomes much cheaper. The FOCUS specification is the most likely place for that to happen.