

An AI assistant can look like a licence. An AI application can look like an API bill. A private AI platform can look like a GPU investment. Follow the work through the organisation and the cost becomes harder to isolate.
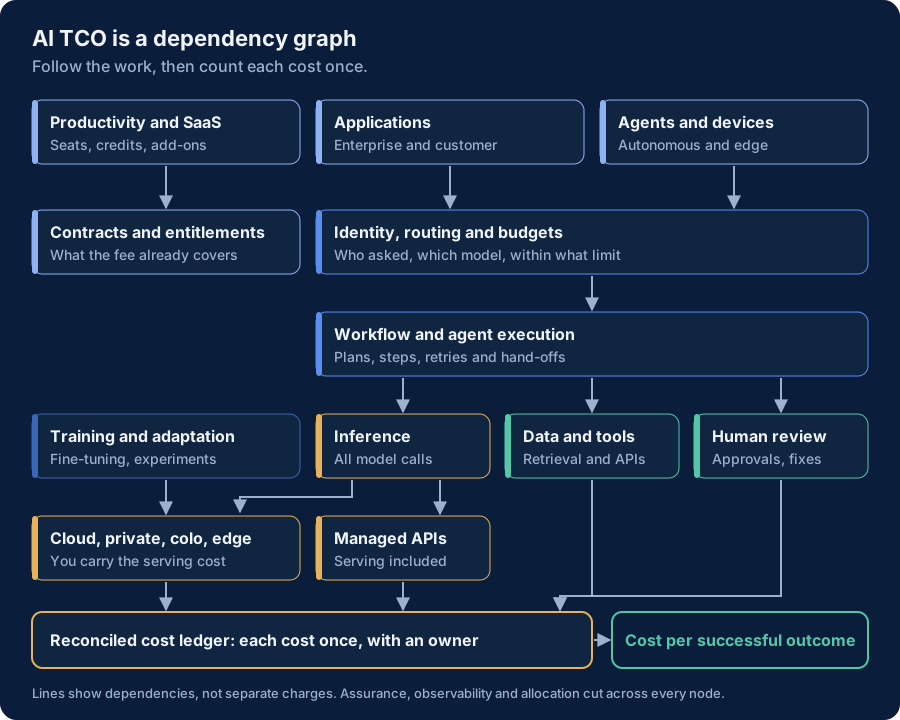
A single customer interaction may involve speech recognition, a language model, document retrieval, queries to business systems, further model calls, a human approval and a generated reply. Each step can have a different supplier, owner, charging unit and allocation rule. A cheaper model can sit inside a more expensive workflow, and an apparently expensive service can deliver the lowest cost of finished work.
This article lists the components of AI total cost of ownership and shows how they connect. It extends the AI TCO Framework: the seven cost layers there remain the site's taxonomy, and this piece explains how work moves across them in an estate that mixes SaaS, APIs, agents, private infrastructure and devices.
Three views of the same estate
A useful enterprise AI cost model needs three connected views.
| View | What it explains | Management question |
|---|---|---|
| Dependency graph | Applications, models, data, tools, infrastructure and people involved in delivering work | What causes consumption, and what changes when demand or architecture changes? |
| Reconciled cost ledger | Supplier charges, workforce, owned resources and shared allocations | What did the organisation spend or consume, and who owns it? |
| Workflow economics | Attributable cost, successful outcomes, quality and realised benefits | Is this a good way to complete the work, and should it scale? |
The three views describe the same underlying costs. Adding their totals together would count the same resources several times.
Where inference fits
Inference is running a trained model to produce an output: generating text, reading images, transcribing speech, ranking results or making a prediction. Embedding models, rerankers, moderation filters and evaluation judges all perform inference, and each can carry its own charge.
For a language model, serving has two main stages: processing the supplied context, called prefill, and generating the response, called decode. Multimodal systems add an encode stage that turns images or video into a form the model can use. NVIDIA's engineers show that whether it pays to run these stages on separate hardware "depend[s] on how work is divided among vision encoding, LLM prefill, and decode", which is a workload question, not a universal saving.
The commercial point is that the same inference can be bought in very different ways:
- inside a productivity or business-software subscription
- through a direct model API or a hyperscaler's model service
- on rented GPU capacity or a specialist hosting platform
- on private infrastructure, in colocation, or on employee and operational devices.
The supplier boundary decides which costs appear on your books. A managed API price already pays for the provider's servers, power and staff. A self-hosted service exposes those resources directly. One cloud model service alone prices by input and output tokens, batch jobs, hourly provisioned capacity, priority and discounted service tiers, cache reads and writes, training hours, stored custom models, images, queries and pages (Amazon Bedrock pricing). The units differ, so token counts are not a common measure of useful work across services.
Training and fine-tuning are separate activities. An enterprise buying access to a pretrained model does not add the provider's training investment to its own bill. It does add the cost of any fine-tuning, distillation or experiments it runs itself.
Agents multiply the dependencies
A person asks for a result. An agent may interpret the request, make a plan, call tools, delegate subtasks, check intermediate results and try again. The cost depends on the path taken to finish the work. A cheap call repeated many times can cost more than a capable model that finishes in fewer attempts and needs less review.
Take a hypothetical voice-based customer-service workflow. Speech recognition creates a transcript. A model decides what information is needed. Retrieval and business APIs supply it. Another model call proposes an action. A person approves an exception. Speech generation delivers the reply. There is no single meter for this. The model provider, the data platform, the business application and the review team each record a different part of the cost.
The Tokenomics Foundation's Seven-Layer Tokenomics Stack, a release candidate dated 4 August 2026, gives a useful architectural vocabulary for the same chain, from energy and physical infrastructure up through serving, model selection, access control and demand. It is a description of how tokens are produced and consumed, not a financial ledger, and it is distinct from the seven cost layers on this site.
The components, area by area
The tables below group the components a complete model should cover. Each component has a default home in one of six cost buckets, set out in the next section, so it is counted once. Some entries are drivers: they explain cost already on a bill, such as retries or idle capacity, and are not extra lines.
The full catalogue, with 71 components and drivers, the bucket each belongs in, what to measure and the matching layer of the AI TCO Framework, is available as a spreadsheet-ready file: AI TCO component catalogue, version 1.0, 20 October 2026 (.csv).
Personal productivity and embedded AI
| Component | Bucket | What to measure |
|---|---|---|
| Assistant seats, including coding assistants | Packaged AI | Paid seats, effective net price, included allowance and overage |
| AI features inside CRM, ERP, HR, service management and collaboration software | Packaged AI | Incremental add-on, or a disclosed share of the bundle |
| Agent credits, actions, conversations and outcome-based fees | Packaged AI | Contract units and included entitlements |
| Subscriptions charged to corporate cards or expenses | Packaged AI | Expense and card records against an approved inventory |
| Unused seats, overlapping tools and expiring credits (driver) | Already in spend | Paid against active use |
Inference and model choice
| Component | Bucket | What to measure |
|---|---|---|
| Managed model APIs | Inference delivery | Billed units at contracted prices, by model, region and tier |
| Reasoning and other provider-specific usage (driver) | Inference delivery | The provider's billable categories, not visible output alone |
| Prompt caching | Inference delivery | Cache reads, writes and retention as the contract defines them |
| Image, video and speech models | Inference delivery | Images, frames, minutes or audio units |
| Predictive, ranking and vision models | Inference delivery | Executions or allocated capacity, with no forced conversion to tokens |
| Embedding, reranking and moderation models | Inference delivery | Auxiliary calls as well as the main model |
| Service tier, batch and provisioned throughput | Inference delivery | Committed capacity and variable use, reconciled by tier |
Agentic workflows
| Component | Bucket | What to measure |
|---|---|---|
| Planning, delegation and multi-agent fan-out (driver) | Inference delivery | Calls per run, depth and completion rate |
| Retries, loops, fallback models and judge calls (driver) | Inference delivery | Attempts per successful outcome |
| Paid tool calls, search queries and commercial data | Data and tools | Paid calls and transactions. A tool protocol such as MCP is not itself a fee |
| Sandboxed code execution and browser runtimes | Data and tools | Runtime, sessions and persistence |
| Workflow state, queues and schedulers | Data and tools | Jobs, durable state and non-model compute |
| Human approval, correction and exceptions | Workforce and change | Review rate × minutes × loaded cost |
| Failed, abandoned and rejected runs (driver) | Every bucket | Keep their cost in the numerator |
Serving and hybrid capacity
| Component | Bucket | What to measure |
|---|---|---|
| GPU and accelerator capacity, rented or owned | Inference delivery | Billed hours or annual asset cost, and utilisation |
| Serving engines, runtimes and support contracts | Inference delivery | Software fees and runtime resources |
| Storage, networking and data transfer for serving | Inference delivery | The serving share only |
| Power, cooling, racks and facilities | Inference delivery | Only where you pay them separately. Energy inside a cloud or API price is not extra |
| Idle capacity and peak headroom (driver) | Already in spend | Paid idle hours and traffic shape |
| Resilience, disaster recovery and regional replicas | Inference delivery | Incremental capacity, counted once |
| Edge and device AI | Inference delivery | The attributable device premium and software, not the whole fleet |
Data, retrieval and model development
| Component | Bucket | What to measure |
|---|---|---|
| Data licences and permitted reuse | Data and tools | Contract, dataset and useful life |
| Ingestion, document processing and quality pipelines | Data and tools | Services and compute; model calls go to inference, labour to workforce |
| Vector, search and graph stores | Data and tools | Storage, queries and index capacity |
| Index refresh, re-embedding, retention and deletion | Data and tools | Data services; the embedding calls themselves are inference |
| Labelling, curation and domain expertise | Workforce and change | Staff or supplier effort and refresh frequency |
| Fine-tuning, distillation, experiments and failed runs | Training and adaptation | Job cost, checkpoints and stored custom models |
People, governance and change
| Component | Bucket | What to measure |
|---|---|---|
| Engineering, data science and platform operations | Workforce and change | Attributable internal time and contracted services |
| Integration, process redesign, adoption and support | Workforce and change | Build, run and change effort |
| Evaluation, assurance, legal and risk work | Workforce and change | Specialist time and professional services |
| Observability, tracing and evaluation tools | Control software | Software and storage not counted elsewhere |
| Identity, access, data-loss prevention and AI security tools | Control software | Incremental or attributable licences |
| Model or provider migrations and forced upgrades | Several buckets | Engineering, regression testing, data movement and dual running |
| Retirement, data export and contract exit | Several buckets | One-off exit cost in the lifecycle view |
Commercial and financial overlays
These change how costs are recorded rather than adding new ones.
- Commitments and credits: purchased against consumed, and expiry. Drawing down a prepaid credit is not a second cost.
- Discounts and marketplace purchases: use the effective net charge, and remove duplicates between invoice, marketplace and provider records.
- Currency and periods: keep the original currency, the reporting currency, the exchange-rate basis and the service period.
- Residency and sovereignty: the duplicated services and local support they require.
- Allocation: by business unit, legal entity, product or customer, with the driver, the owner and any unallocated remainder shown.
- Capital and depreciation: one consistent basis. Never add an asset's purchase price and its depreciation to the same total.
- Telemetry against invoices: list-price estimates from traces, reconciled to contracted rates, credits and corrections.
Three things belong in parallel ledgers rather than in base TCO: carbon and water footprint, expected losses from downtime, incidents or errors, and benefits such as revenue, savings and released capacity.
More complete coverage must not mean double counting
A dependency graph can contain a licence, an API, a model runtime, GPUs and electricity. That does not make them five separate charges for every deployment.
Three other boundaries matter.
- Waste is part of incurred cost. Idle GPUs, unused seats and failed requests explain a bill. They are not an extra percentage to add on top of it.
- Cash and allocated cost answer different questions. Existing staff time may create no new invoice but still uses capacity. Report incremental cash and fully allocated cost separately.
- Benefits belong in a separate view. Released employee capacity, avoided spend and realised cash savings need different evidence. Do not deduct an assumed productivity gain from gross TCO and present the result as an observed cost reduction. The Tokenomics Foundation's value classification (Release Candidate 2) makes the same separation: a measured value claim becomes a return only once the total cost of AI is set against it.
For an annualised comparison, include recurring spend plus the annual share of reusable build investment and owned assets. Keep a separate view of cash, commitments and exit exposure.
Six buckets for the ledger
The seven layers of the AI TCO Framework are deliberately overlapping: integration work, for example, involves both people and software. For a ledger, each cost record needs one home. The six buckets below are a presentation device for that purpose. They do not replace the seven layers, and each maps back to them.
| Bucket | Includes | Maps to the AI TCO Framework |
|---|---|---|
| Packaged AI | Assistant seats, AI add-ons in business software, credits and overages, including the inference inside those fees | Models |
| Inference delivery | Direct model APIs, and the serving compute, runtime, network and facilities you operate yourself | Models, Infrastructure |
| Data and tools | Data rights, storage, retrieval, connectors, paid tool actions and non-model compute | Data and context, Integration |
| Workforce and change | Internal and contracted labour for build, operations, data work, adoption, evaluation and review | People and capability, plus the labour in Integration and in Governance |
| Control software | Security, observability, evaluation, gateway, inventory and financial-control tools, excluding labour and model calls | Governance, Operations |
| Training and adaptation | Fine-tuning, distillation and experiment compute, and custom model artefacts | Models, Infrastructure |
Record each person's time once, in workforce, and tag it with the work it supports. Ordinary end-user time on a task is a process-cost question, outside AI TCO, unless it is additional review or support caused by the AI.
Where might the largest costs sit?
We found no defensible universal cost mix for enterprise AI in the sources reviewed for this article. The answer changes with the operating model, the supplier boundary, the review burden and the treatment of shared resources.
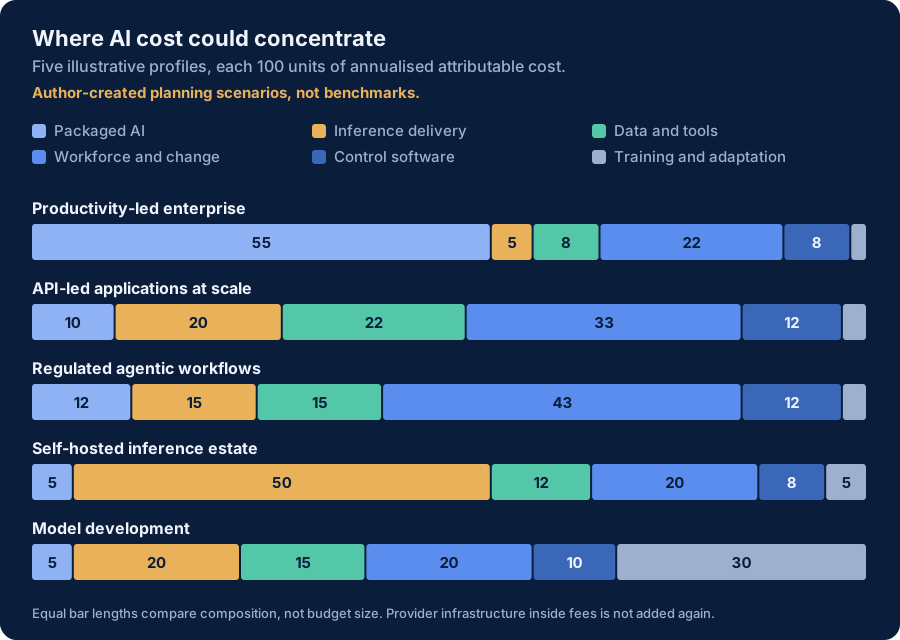
The dominant line changes by profile, and so does the first question to ask.
- Productivity-led: investigate entitlements and adoption. Compare paid seats with active use, look for overlapping tools and separately billed coding agents.
- API-led: inspect the calls and services needed to finish a task, using real request distributions, contracted rates, cache hit rates and failed-run counts.
- Regulated agentic: measure review minutes and rejection rates. The workforce share is a hypothesis to test, not a figure taken from McKinsey's variable-cost split.
- Self-hosted: test useful utilisation against service obligations, including paid idle capacity, supporting staff and refresh costs.
- Model development: a specialised comparator, not the default enterprise. It carries repeated experiments and model refresh.
In a real organisation these profiles coexist. Build the total from actual workload costs and weight business units by what they actually spend. An unweighted average of the five rows would be another invented benchmark.
Cheaper inference does not mean proportionately cheaper TCO
In the illustrative API-led profile, inference is 20 of 100 cost units. Halving the inference price, with everything else fixed, takes the total to 90 units: a 10% saving, not 50%. If usage doubles at the same time, the inference line is back where it started, and any extra tool calls, review or capacity push the total higher.
Quality changes the denominator too. If total cost stays at 100 units but successful outcomes fall from 90 to 60, cost per successful outcome rises by 50%, from 1.11 to 1.67 units. A lower model price can coexist with worse workflow economics.
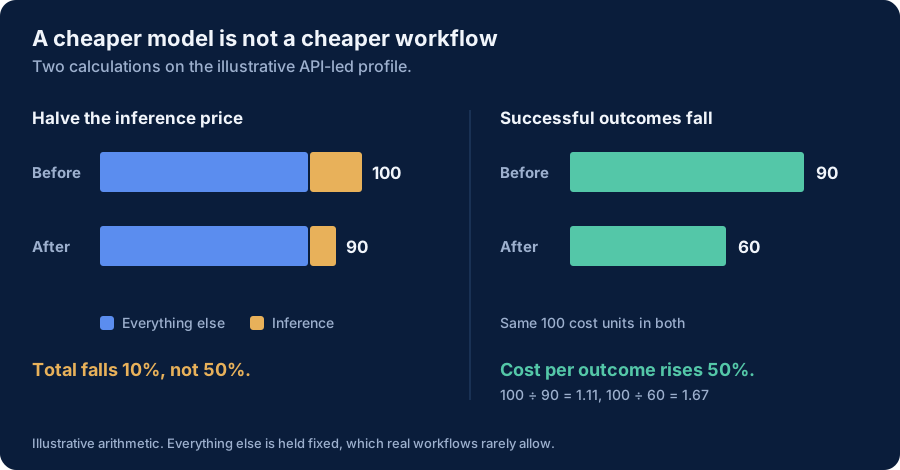
The decision measure is:
Cost per successful outcome = all attributable workflow cost
                            ÷ outcomes that met the agreed quality and service standard
Keep the cost of failed and rejected attempts in the numerator. Define success before measuring it, using a quality floor. Then compare the cost, quality and speed with the pre-AI baseline and with credible alternative ways of doing the work. The cost per successful outcome calculator runs this comparison for two setups.
Instrument the work, reconcile the money
Request tracing and financial reporting do different jobs. LLM observability tools can group related requests into a session and slice cost by custom properties. Tracing platforms let teams define their own model prices and load costs they supply themselves, for example for self-hosted models. Model gateways can attribute spend to keys, users and teams, and log each upstream attempt separately, so retries are visible. These are useful building blocks. None of them, on its own, establishes fully allocated enterprise TCO: they miss SaaS seats, negotiated rates, facilities, workforce and uninstrumented traffic.
For a priority workflow, link the originating request to its agent steps, model calls, external tools, human interventions and final outcome. Keep the model version, provider, region and environment on each record. Then reconcile estimated consumption cost to contracted charges and invoices.
A ledger that supports this needs, at minimum, these fields on each cost record: source system and invoice line, provider and contract, service period, original and reporting currency with the exchange-rate basis, gross cost, discounts and credits, net cost, bucket, workload and root workflow identifier, business owner, legal entity, business unit, region, environment, allocation driver and share, and whether the figure is measured, estimated or allocated.
Start with one material workflow and one reporting period. Establish its owner, its cost boundary, its share of shared platforms and its success criteria. Measure exceptions and failed attempts. Then ask which intervention changes the economics most: a different model, fewer steps, better retrieval, less review, a different hosting arrangement or a redesigned process. The AI TCO worksheet prices one use case this way.
A complete cost model earns its place by changing that decision. It should show which dependency to improve, what the improvement is expected to save, and whether the outcome stays good enough to justify the work.
Sources and methodology
Sources checked on 20 October 2026. The cost profiles, buckets and calculations are this publication's independent illustrations; none of the sources below validates their percentages. This article paraphrases and adapts concepts from FinOps Foundation and Tokenomics Foundation materials published under CC BY 4.0; it is not endorsed by either organisation. Vendor documentation is cited for what the products document, not as a recommendation.
- FinOps Foundation, "FinOps for AI". Living framework page: scope across procurement channels, allocation and unit economics.
- Gu, J., McCormick, R. and Kamath, A., "When to Use Encode-Prefill-Decode Disaggregation to Accelerate Multimodal Model Serving", NVIDIA Technical Blog, 9 September 2026. Serving stages; results depend on the workload.
- Tokenomics Foundation, "The Seven-Layer Tokenomics Stack", release candidate listed 4 August 2026 on the projects page.
- McKinsey & Company, "Where AI agents pay off: A practical guide to the economics of agentic workflows", August 2026. Banking examples of variable run cost; not a market-wide cost mix.
- Tokenomics Foundation, "Why Tokens Aren't the AI Bill: Introducing Total Cost of AI", episode 17, 7 September 2026. Practitioner estimate of the token share of AI cost.
- Tokenomics Foundation, "Classifying and Measuring Realized Value from AI", Release Candidate 2, updated 16 September 2026. Separation of value claims, realisation and return.
- Deloitte, "Follow the AI tokens: How CTOs can manage tokenomics for cost, scale and control", 16 March 2026. Contract terms, hosting options and lock-in; no cost shares.
- AWS, "Amazon Bedrock pricing". Range of charging units for one cloud model service; no prices are used here.
- Helicone, "Cost tracking and optimization"; Langfuse, "Token and cost tracking"; LiteLLM, "Spend tracking". Product documentation on session costing, custom prices and attribution, read as examples of each tool category.